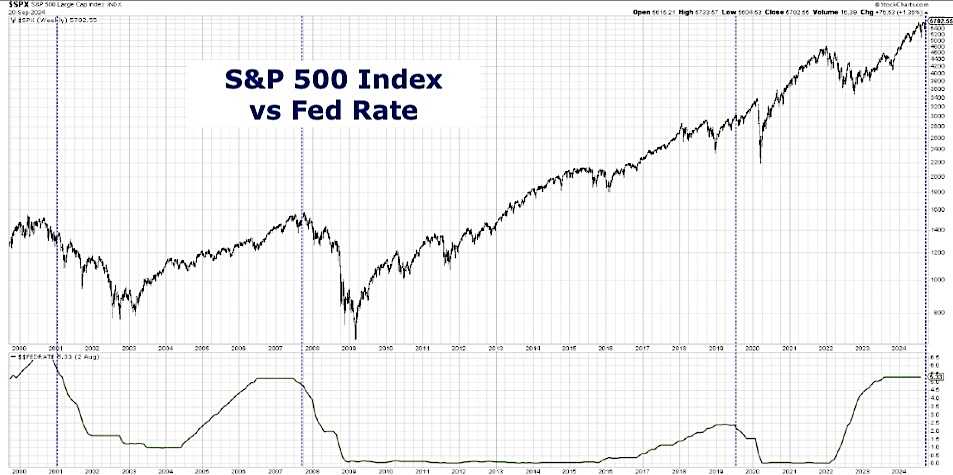
The Federal Open Market Committee recently cut their target interest rate by 50 basis points, sparking debates on its implications for the stock market.
Historically, interest rate cuts have led to both long-term growth and short-term pain, as seen in past cycles like those in 1995, 2001, 2007, and 2019. Today we’ll examine the S&P 500’s performance post-rate cuts and what that may mean for investors between now and year-end.
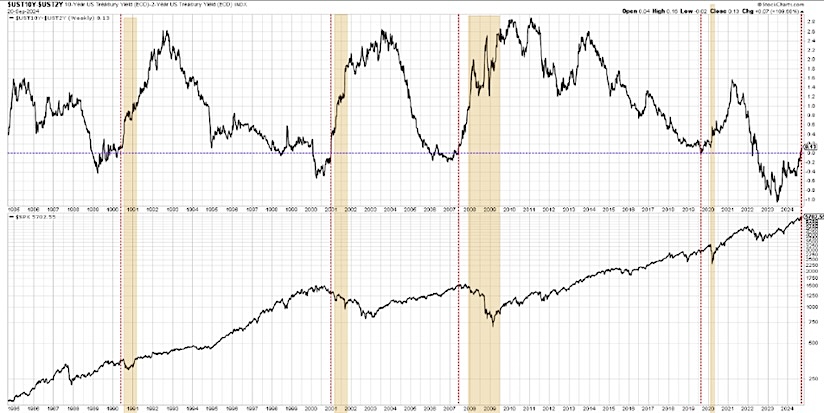
Interest rate cuts are actually quite infrequent, happening roughly once every decade, and their impacts have varied depending on broader economic conditions. The yield curve’s behavior, especially its inversion and subsequent normalization, also plays a crucial role in market predictions.
While a normalized yield curve can precede challenging periods for equities, understanding these patterns is vital for long-term investment strategies. See attached charts below video for added context.
In today’s video:
- What tends to happen to stocks after the Fed’s first interest rate cut, both short-term and long-term?
- How have historical Fed rate cut cycles, such as in 1995, 2001, 2007, and 2019, affected stock market performance?
- How does the yield curve influence stock market movements following a Fed rate cut, and what is its relationship to upcoming recessions?
Video: Should Investors Cheer Interest Rate Cuts?
Stock Market Performance versus Yields Charts
Twitter: @DKellerCMT
The author may have positions in mentioned securities at the time of publication. Any opinions expressed herein are solely those of the author, and do not in any way represent the views or opinions of any other person or entity.

 and Semiconductors (SMH)")
")

 Make A Higher Low?")
")
 and Semiconductors (SMH)")