Considering EVERYTHING:
- Yields and mortgage rates
- War
- Inflation and rising commodity prices
- Bank stocks falling
- Risk Gauges 2 out of 6 now risk-off
To name a few, why then is the S&P 500 so strong?
Here are a few reasons:
- Fed members suggest rate hike pauses.
- Hope that the war lateralizes rather than escalates.
- Economy stats mixed with retail sales and labor strong.
- Sidelined cash in money markets could move into equities.
- Seasonally, Q4 and pre-election years are historically strong.
Besides the SPY chart, we are also watching the price in small caps.
I feel like I have written the same themes repeatedly. It’s almost like a mantra-
- Watch price and timeframe in the economic modern family
- Watch commodities
- Watch risk gauges
And here we are still stuck in time as time seemingly stands still amidst the increasingly faster speed and plethora of news.
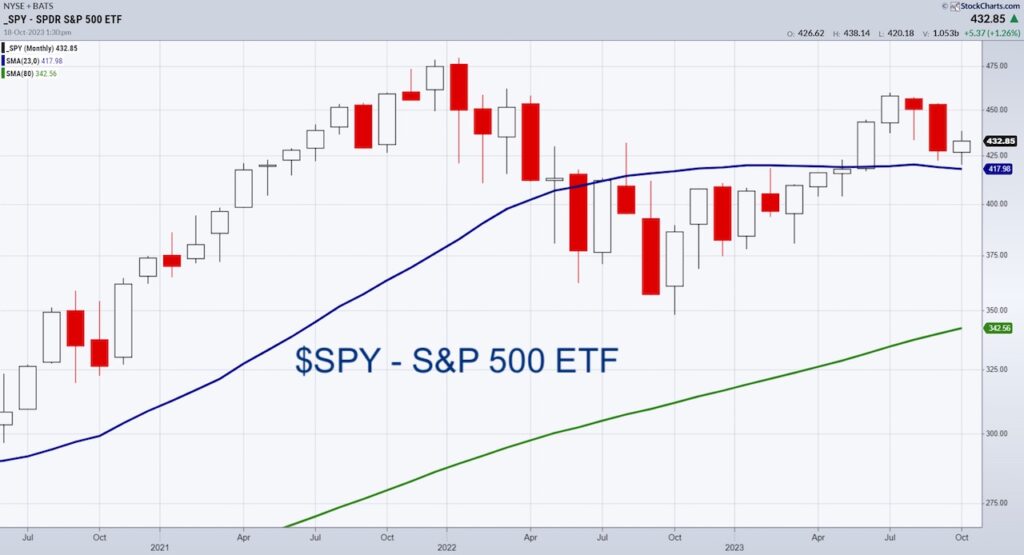
The SPY monthly chart is not bearish. It could turn out that way, but presently, SPY sits atop the blue line or 23 month moving average.
We have 2 weeks left in October, so we are watching 418 level carefully. We are also watching 450 as resistance carefully. After all, a trading range is not only possible, but also plausible.
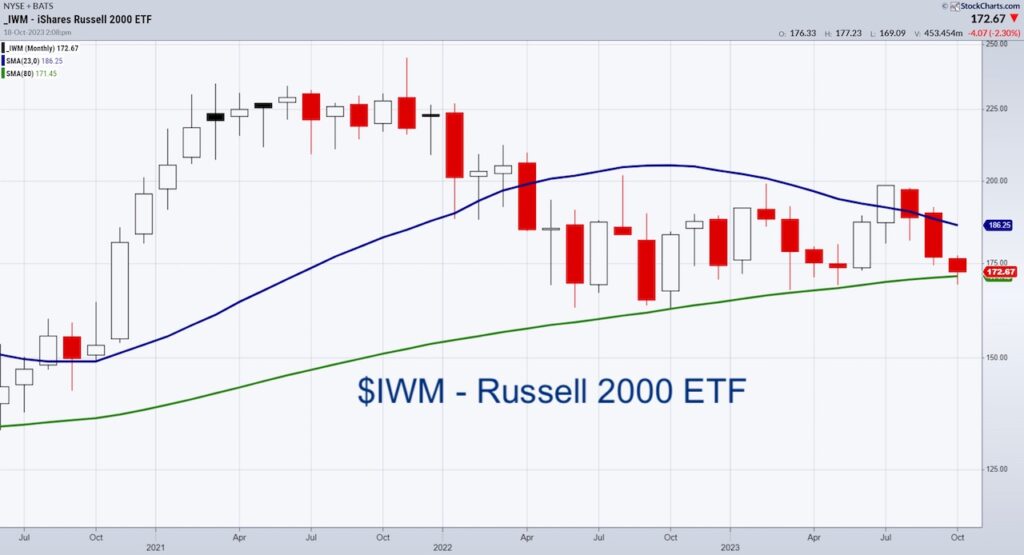
The small caps look more vulnerable.
Hence, we look to them to tell us what’s next.

Negatives:
- A declining slope on the 23-month MA
- A narrowing between the 23 and 80-month MAs
- An unimpressive bounce off the 80-month MA (green line).
Positives:
- IWM is still above the 80-month MA
- His wife, Granny Retail XRT is potentially making triple bottoms off of the October 2022 lows.
- Tune out the noise and follow the charts.
Twitter: @marketminute
The author may have a position in mentioned securities at the time of publication. Any opinions expressed herein are solely those of the author and do not represent the views or opinions of any other person or entity.


