In a newsletter I wrote in August, I speculated that we might be in a stealth bear market. This was certainly not something that I predicted for 2015, just an after the fact observation.
So what is a stealth bear market and what are the implications from here? A stealth bear (my definition) is a market where the majority of individual stocks fall 20% or more, while the major stock market indices do not come close to bear territory. Everyone knows about the carnage in certain areas of the market this year. That has been masked by the performance of the major stock market indices, which have been held up by a somewhat select group of very large mega cap stocks.
If you happened to be in the right stocks this year, you probably did pretty well. If you kept bottom fishing during the year, you may have had your head handed to you.
Another term for stealth bear market might be an internal bear market. Market internals are not great, and when the major indices hold near their highs, as they did for much of this year, many ignore the deterioration under the hood. I will admit that many of the best traders I have observed on social media are price only technicians. My background as a strategist for many years forced me to take a broader view of the market and its underlying technicals. This could be a great conversation for a later date.
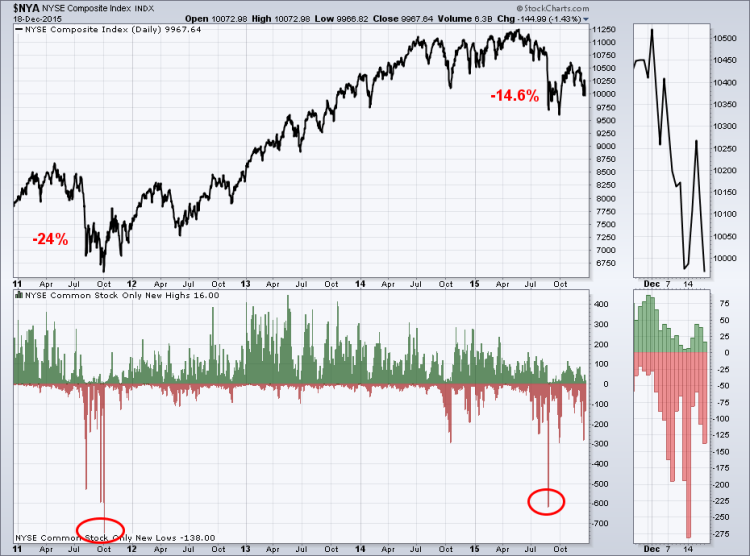
So why did I proffer that we might be in a stealth bear market? The next two charts illustrate that fairly well. In 2011, the NYSE fell 24% in what turned out to be a very quick bear market within the confines of a longer-term bull market in stocks. The first chart shows that NYSE common stock only new lows hit about 750 (guessing based on chart). During 2015, the NYSE fell 14.6% or what some would consider a median sized correction. However, new lows during this correction hit a whopping 620 (guess) issues, far more than would be expected based on the 2011 numbers.
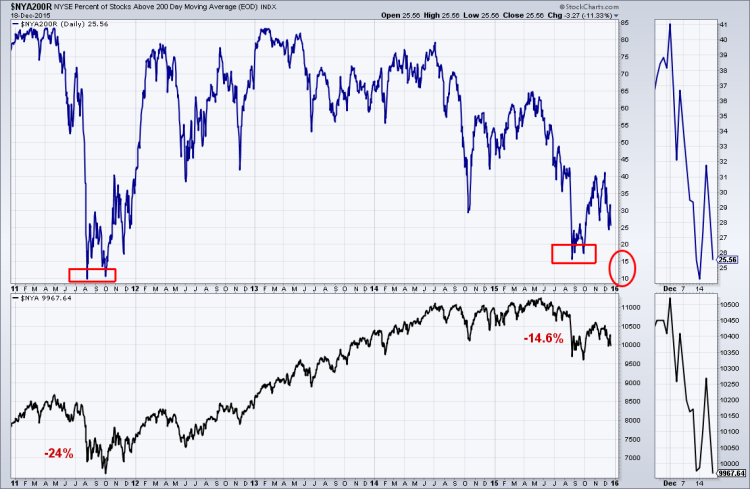
The second chart shows the NYSE compared to the percentage of stocks above their respective 200-day moving averages. When a stock falls below its 200-day average, it is for the most part in a long-term downtrend or bear market. Now, just because a stock or index is below its 200-day certainly does not suggest that it has dropped 20% or is in its own bear, but it certainly suggests an overwhelming deterioration by many issues. When the NYSE fell 24% in 2011, the percent of stocks above their 200-day declined to about 10%. So, 9 out of every 10 stocks could be considered in at least intermediate- to long-term downtrends. With the 14.6% drop in the NYSE this year, the percent of stocks above their 200-day fell to only 15%. So
8.5 out of 10 were below their longer-term averages and very close to what was seen internally in 2011’s bear market. That’s a stealth bear market.
Well, things turned out very well after the brief bear in 2011. Yes they did.
However, 2011 was only 2 years into the current bull market, and today were talking about a market that will reach its 7th year anniversary in March 2016. Now that’s an aging bull.
continue reading on the next page…


