For context: I’ve been bullish on stocks for many years and I’m still very bullish over the longer term (4+ months). However, there are a few factors that are aligning here to create some risks for stock market bulls. This is a story that might be best told in pictures, so here’s a ‘chart roll’ that captures the current S&P 500 chart setup.
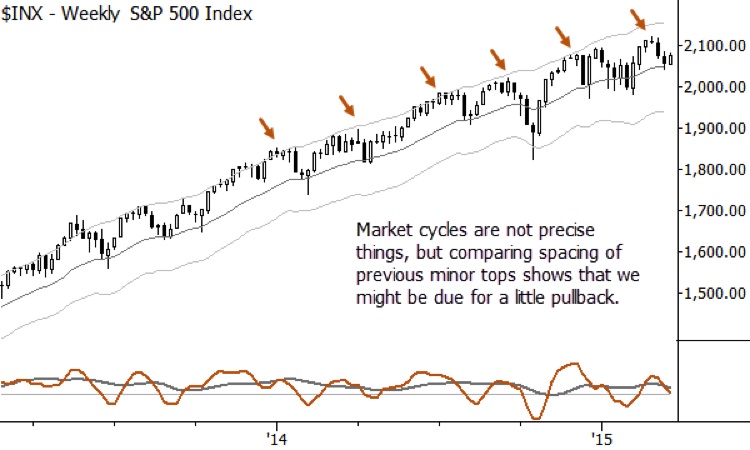
Keep an eye on those minor tops.
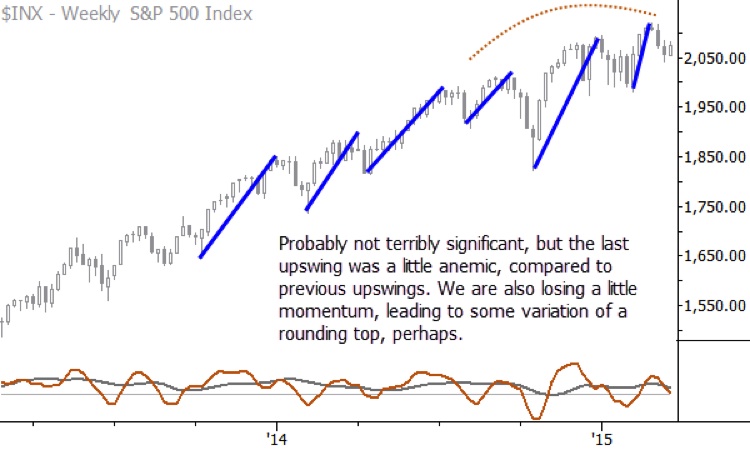
The latest upswing appears to be losing momentum and this makes the current S&P 500 chart setup a bit weaker.
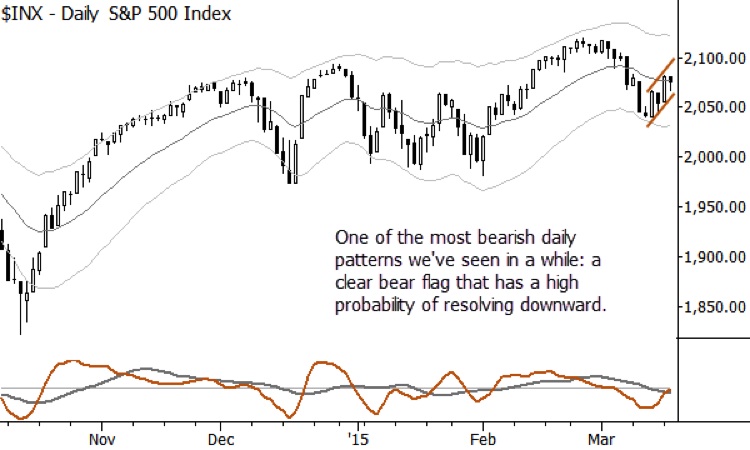
Is that a bear flag pattern on the S&P 500 daily chart?
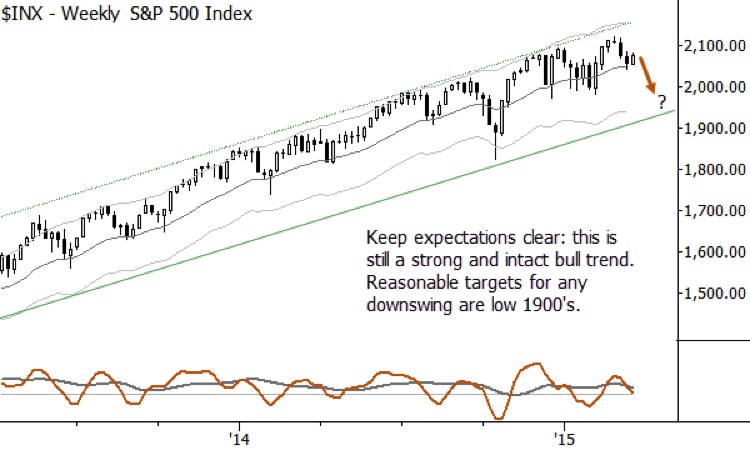
If we do indeed rollover, here’s a look at where the S&P 500 might be headed.
Today’s FOMC statement could be a catalyst that moves markets significantly. One of the key ways I phrase market moves for research clients is by laying out scenarios (we don’t know if this market will break up or break down today so we need to think about both) and appropriate actions for each of those scenarios (if it breaks down, due to these bearish factors, we do not want to be quick to buy weakness). This is not at all a call for a market crash, but it is a warning: buying the dip has been a trade that has worked well for many quarters, and we’d be reluctant to buy any dip today. There is maybe just a bit too much coiled bearish potential for comfort in the current S&P 500 chart setup. Longer-term, everything we see still points up, so there quite likely will be a spot to buy selloffs—just err on the side of caution today.
Thanks for reading.
Follow Adam on Twitter: @AdamHGrimes
No position in any of the mentioned securities at the time of publication. Any opinions expressed herein are solely those of the author, and do not in any way represent the views or opinions of any other person or entity.


