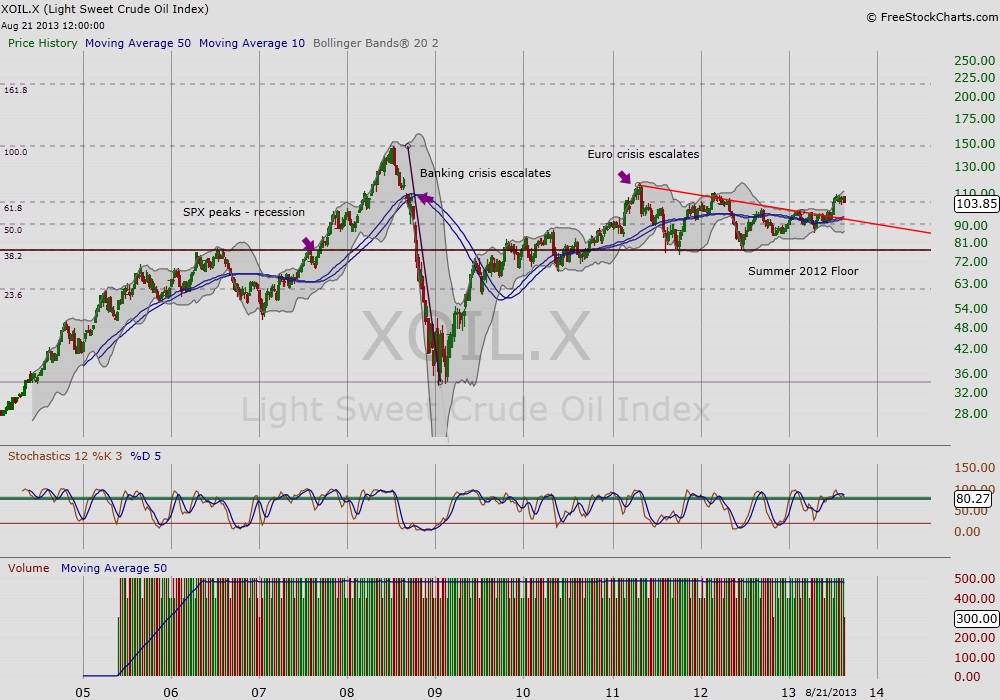
 The oil paradox is simply when demand confirms recovery early in a bull market cycle and prices continue rising until outsized input costs later precipitate a price fall. To better understand how this works, I will analyze the relationship of Crude Oil to Equities (the S&P 500 Index) by comparing the weekly chart of crude oil to the action found in the equities market.
In 2003, oil and equities found a base that eventually lead to a steady climb in 2004. Both continued their march higher, however, while U.S. equities peaked by late 2007, crude oil prices continued to rise for another year. This was due in part to rising demand in China and other emerging markets. The party would not last forever, and the peak in oil served as an early warning that the equities dam would soon break as it had in previous cycles. Fall 2008, Lehman files for bankruptcy, light sweet crude oil index (XOIL.X) breaks below its 10/50 week ma, and in turn the equities market slides into free-fall that October.
Crude Oil and 2009 Recovery
Early 2009, crude oil prices bottom along with other early movers. By late 2009, we can see oil begin to once again sputter and stall. This time, declining demand in oil was coincident with the Chinese market topping, and the first news out of Greece and Dubai that the US banking crisis had made its way across the pond. The following years, crude oil provided intermarket early warning signals for the equities market.
When is high too high?
The Euro crisis heats up by the summer of 2011, and would provide a bench mark for when crude oil prices simply got too steep no matter how much assistance the world central banks provided to buoy the equities market. Both in summer 2011 and 2012, light sweet crude oil index (XOIL.X) found a floor in the mid-seventies. Following the summer floor in 2012 and subsequent fall correction, the sentiment of “doom and gloom” from the prior years was replaced to what has now been coined as the Great Rotation from bonds to equities with the return of inflation. Although, there are early signs of real improvement in the economy, the price of crude oil continues to hang over the recovery like a dark cloud. Unlike in previous market cycles, the “bottom” of this business cycle did not see a significant bottom in oil prices. In fact, going to the pump continues to be a pricey expenditure for households still struggling. It is no wonder that as oil returned to peak 2011 levels this July and only one month after the equities market seemed to have found its yearly summer floor, the uptrend hit a real snag.
Time to look for crude oil to find support or break down
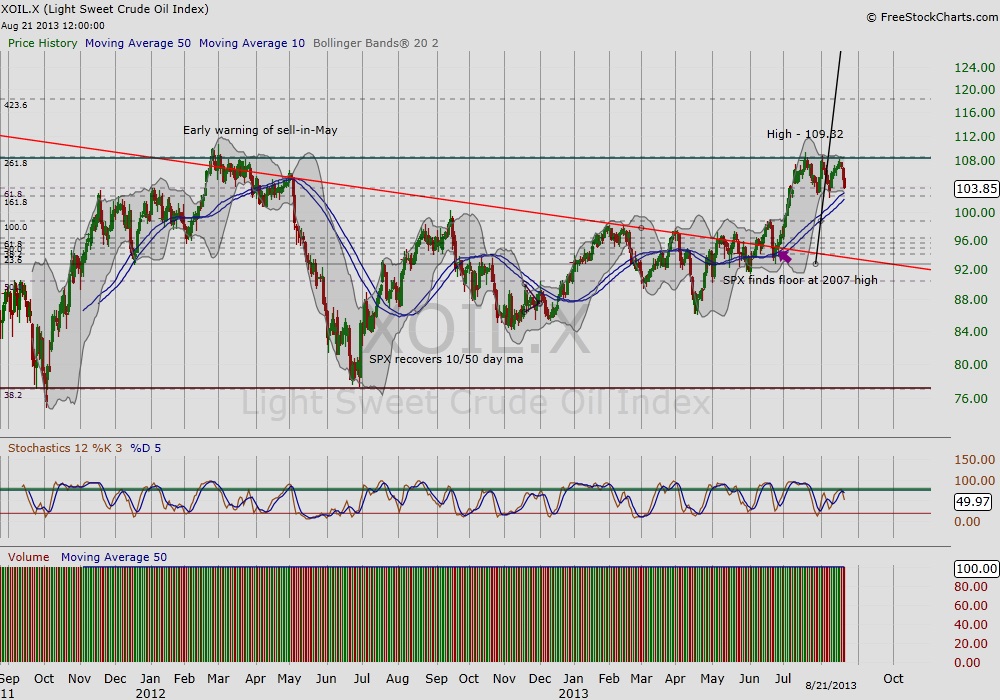
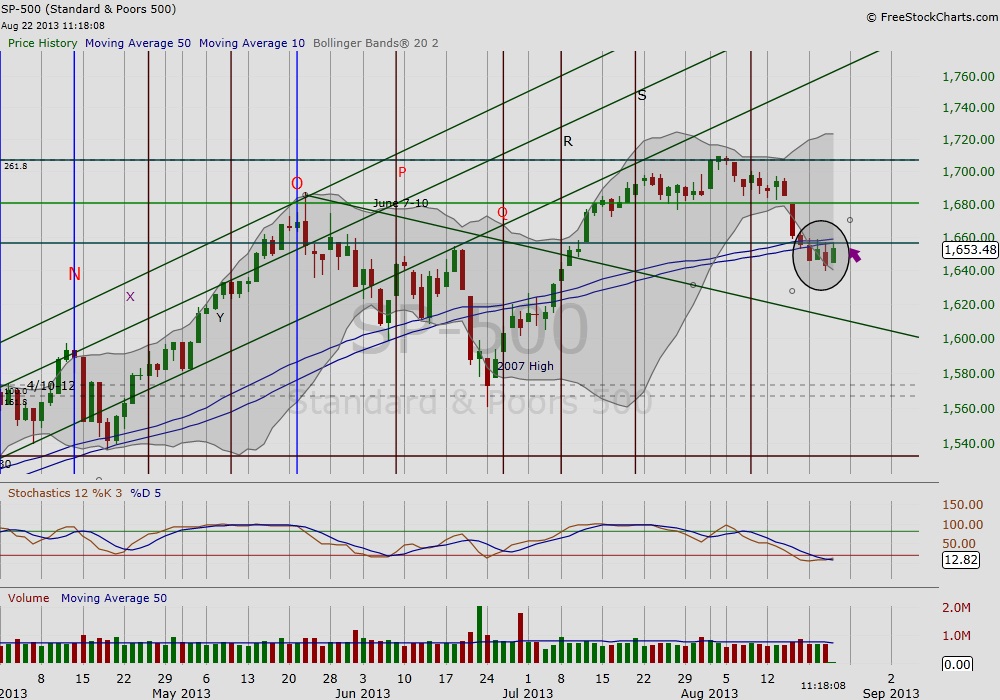
The next two charts are the daily charts of light crude and the SP-500 (SPX). Today, oil is at the top of the 10/50 day ma, where we look to see if it will find support. The next chart is the SPX in recent days just hanging on with one proverbial finger below its 10/50 day ma. Given the precarious predicament of both vehicles, we may see a resolution in the coming days. For oil to find support and later break the 2011 ceiling will provide another confirmation for the market that the economy and the consumer is truly better off than they have been in recent years.
Crude Oil Price Chart (2 Year)
S&P 500 Index Daily Chart (4 Month)
Thanks for reading.
Twitter: @RinehartMaria
No position in any of the mentioned securities at the time of publication. Any opinions expressed herein are solely those of the author, and do not in any way represent the views or opinions of any other person or entity. Charts from FreeStockCharts.com
Please check us out on Alexa and feel free to provide feedback.


