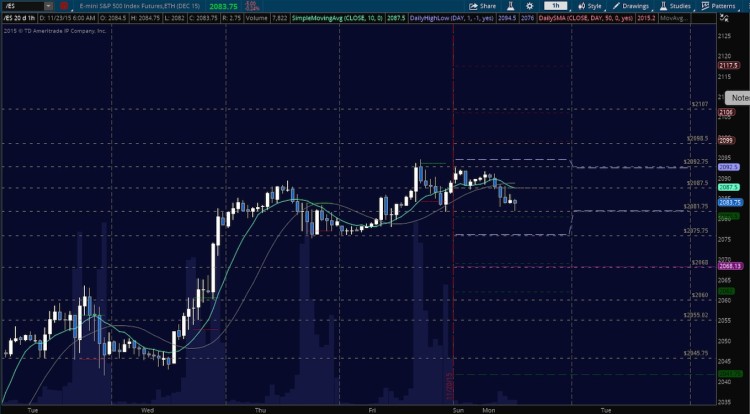
The S&P 500 futures (ES_F) chart developed some negative momentum that is holding this morning as the chart tests failed S&P 500 support on both sides of 2075.75. In early morning trading, the futures failed in their attempt to recapture the former S&P 500 support level and now support sits closer to 2065.
We should have a week of thin volume. Markets are a little unsettled – they feel somewhat skittish, and the strength of movement sits with the sellers this morning. A recapture of 2084 on the S&P 500 futures would be key for bulls, and give buyers more courage to enter the fray.
The day appears to be setting up for a trending short day but based on momentum, it seems still quite clear that buyers will come in at S&P 500 support levels.
Near term S&P 500 support now lies beneath near 2065 region and near term resistance near 2092 region. Breaches are likely to retest before continuing due to damp momentum readings. Steep pullbacks are likely to be buy zones rather than breakdowns unless there are news events that make the markets nervous.
Shorter time frame momentum indicators are bearish, and lower than Monday. Longer cycles are still bullish, but momentum is tepid at best. All indicators on longer time frames at this point show buyers are still in charge, but their strength is not aggressive.
Click here for an economic calendar with a rundown of releases.
RANGE OF TUESDAY’S MOTION
Crude Oil (CL_F)
A Turkish air strike on a Russian jet is being credited with the move upward in crude oil prices. To me, it just seems like basing behavior, and appears to be mildly bullish overall. I’m not suspecting the retrace we had yesterday off any movement today. But as always, I will be watching the edges for breaches up, breaks down and confirmation. The critical region that needs to holds for buyers is near 41.4. Right now, we have a secondary support zone near 41.8. The breakout region is now 42.54 for the upside and 41.8 for the downside today.
A retest of 42.54 sends us near 42.8, then 43.3, and perhaps into 44. Breakdown below 41.8 sends us near 41.45, 40.79 to 40.14, and perhaps into 39.9. Momentum on shorter time frames is slightly bullish.
S&P 500 Futures (ES_F)
Chart With Levels For The Week
Upside motion is best setup on a recapture of S&P 500 support near 2074.75, as a band of buyers is forming there. If the buyers have limited power, the chart will fail to breach and hold 2083.75. Momentum is bearish on tighter time frames – formations are still range bound. A hold of 2084 should deliver 2087.25, then 2089.5, 2092.5, 2094.25, and potentially 2097.25, and 2100.25 as targets.
Downside motion below the failed retest of 2074, or at the failure to hold 2083.25 (watch momentum- that would be aggressive ) opens a short. Short trades should be staged into lower S&P 500 support and then cautiously watched after some profit is taken, until we fail 2045 on a retest- that level represents a very strong buying support zone and will keep the chart essentially bullish on larger time frames. Buyers are still in charge, though patterns look very tired. Retracement into lower levels from 2083 give us the targets at 2081.75, 2077.5, then 2075.75, 2071.5, 2067.75.
If you’re interested in the live trading room, it is now primarily futures content, though we do track heavily traded stocks and their likely daily trajectories as well – we begin at 9am with a morning report and likely chart movements along with trade setups for the day.
Thanks for reading.
Twitter: @AnneMarieTrades
Any opinions expressed herein are solely those of the author, and do not in any way represent the views or opinions of any other person or entity.


