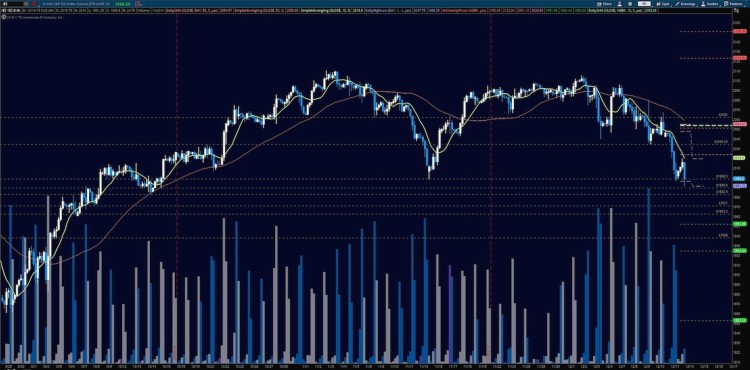
S&P 500 Futures (ES_F) expanded nicely after a wild swing into the Fed release. Charts have expanded almost 90 points in the futures market in three days. This range of motion runs from the regions near 1983 and 2072.
The move is not sustainable without a pullback but pullbacks should find buyers at the ready.
Short term futures support is now near the 2055.5 mark; and resistance near 2072.5 (this could be a breakout area but momentum should be carefully observed here). Momentum readings are positive and lifting still– that means we watch for bounces to hold after small pullbacks as long as primary support of 2037 holds on the day. Buyers should step in at support. Watch for lower highs to give the signals that the upside is fading when charts are expanding like this. As long as they do not appear, we will advance.
Short time frame momentum indicators are positive and rising, and higher than Wednesday. Longer cycles are downward trending, and back into neutral territory.
See today’s economic calendar with a rundown of releases.
RANGE OF TUESDAY’S MOTION
Crude Oil Futures (CL_F)
Moving average squeeze has appeared on the 4 hour chart. Watching the resolution here will be key. After a deep candle down, oil is recovering. Though I anticipate further downside, I see very jagged price action here. It will not be simple to trade. We are still looking for the higher lows to continue. Intermediate term support for Crude Oil still sits at 35.3, but the higher low near 36.03 has shown up. Resistance lies near 37.27, then 37.9, if that is breached and holds. For an intraday trading formation, we see a range event between 36.26 and 37.25, noting that momentum and trend are both bullish, and holding in shorter time frames. Breach above a 37.26 retest sends us near 37.55, then 37.9 and perhaps 38.3. Below a 36.2 retest sends us to 36.03, 35.75 and perhaps 35.4. Momentum on intermediate time frames is positive but falling.
E-mini S&P 500 Futures (ES_F)
This week’s chart with active S&P 500 futures support and resistance trading levels. Click to enlarge.
Upside motion is best setup on the bounce off the 2055, but it is not clear whether the chart can retrace to these lows before the move ahead once more. A test of 2061.25 makes a reasonable setup as well. The breach of 2073 will likely bring excited buyers in but watch momentum carefully here. Strong momentum suggests we could see futures levels of 2077.25, 2085, and perhaps even 2092.5 in the coming days. A hold of 2061.75 should deliver 2064.5, 2068.25, then 2071.5, 2072.5, 2077.25, and perhaps 2085.25 and 2092.75.
Downside motion below the failed retest of 2067.5, or at the exhaustion formation that might show up at 2089-2092 (not likely we see that today). Retracement into lower levels from 2067.5 gives us the targets at 2064.75, 2061.25, 2057.5, 2055.25, 2053.25, and 2051.75. Lower levels are likely if the chart collapses, so review the blog for proper levels if the chart moves down.
If you’re interested in the live trading room, it is now primarily futures content, though we do track heavily traded stocks and their likely daily trajectories as well – we begin at 9am with a morning report and likely chart movements along with trade setups for the day.
As long as the trader keeps himself aware of support and resistance levels, risk can be very adequately managed to play in either direction as bottom picking remains a behavior pattern that is developing with value buyers and speculative traders.
Visit The Trading Vault to learn how to trade the way I do. Thanks for reading.
Twitter: @AnneMarieTrades
The author trades futures every day and may have a position in mentioned securities at the time of publication. Any opinions expressed herein are solely those of the author, and do not in any way represent the views or opinions of any other person or entity.


