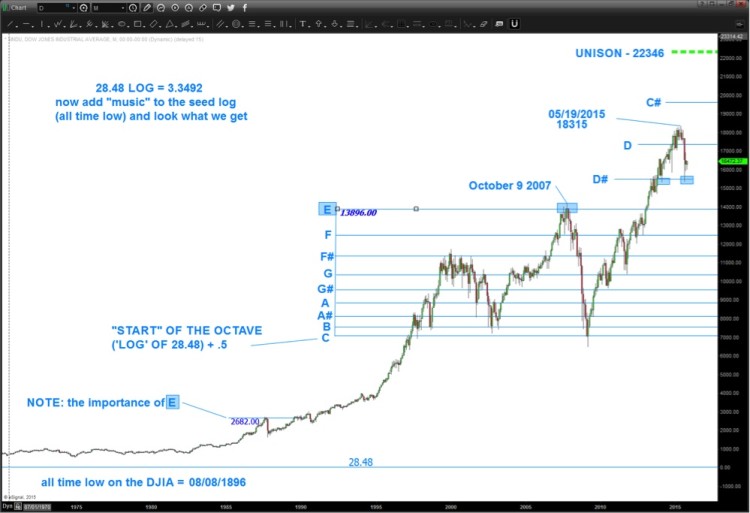
Honestly, I asked myself the question above and what you’ll see is the result of starting from the all-time low on the Dow Jones Industrial Average (DJIA) at 28.48 on 08/08/1896 some 43,528 calendar days ago as of this writing and simply “did the math.”
As a review it’s important to understand the following “basic” aspect of the vibrational/musical nature of the market:
1. The frequency of a string is:
- inversely proportional to the square root of its length and
- directly proportional to square root of its tension
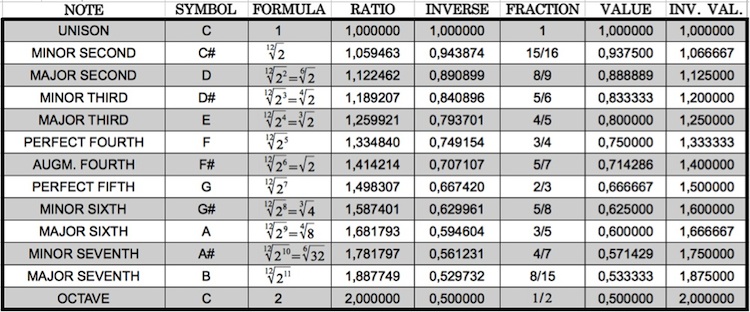
- here is a chart of the notes and the ratio’s and their inverses
2. Below is a chart of the ratio’s that make up the equal octave scale of music
- Note the “inverse” portion – that will be the numbers we add to the log of 28.48 – the all-time low on the DJIA.

Chart source: Sacred Geometry
- Here is the math:
- 28.48 LN = 3.3492
- 3.34492 + ratio of equal octave scale = XXX
- anti-log of XXX = YYY
- plot YYY on long term monthly of DJIA
- For example:
- NOTE E: ratio 1.259921 and the inverse 1/1.259921 = .7937005
- 3.3492+.7937005 = 4.1429005
- 4.1386205 anti-log = 13896
- interesting to note how close that was to the top in 2007
- some 20 years prior the same “E” was wreaking havoc – here’s the math
- 3.3492+.07937005 (note the number stays the same – JUST SHIFT THE DECIMAL POINT) = 3.42857005
- anti-log of 3.42857005 =2683
Is it any coincidence that the musical note E was found in 1987 and 2007 from the all-time low in 1896?
So what does this mean?
- In 1997 the market came up and started another octave and has been banging in/around C-E for the past 20+ years.
- Note, the market did not CLOSE below the start of the octave “C” in 2009
- If I was in charge (and trust me I’m not) I sure think this market naturally wants to finish it’s symphony, so to speak, so is 22K out of the question?
- Who knows but I’m certainly going to be aware of these long term targets from 1896 as a guide.
- Also, do you think it’s any coincidence that the musical note E w/ a decimal shift was responsible for the high in 1987 and 2007?
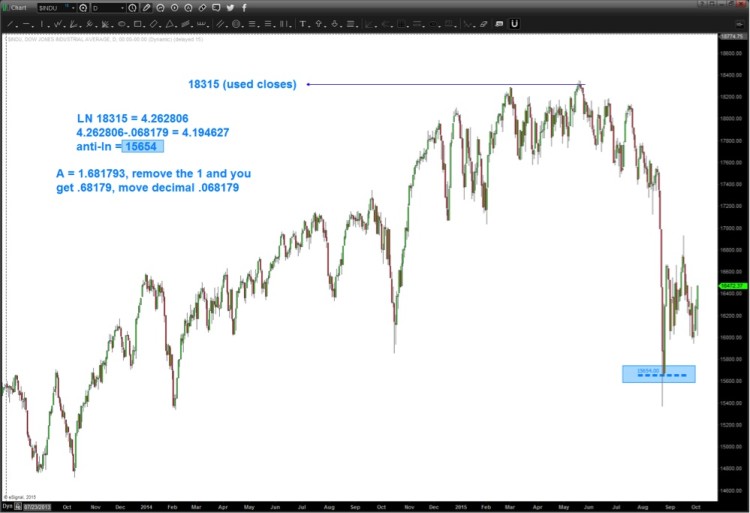
- How about the most recent move lower?
Do I claim to call the TOP and BOTTOM? No, not at all.
All I’m trying to point out is that the market does, in fact, vibrate to natural law and the principles of mathematics and music.
Pay attention to the levels discussed in this post. As the former master trader and mentor, Mark Douglas, described in his seminal work “Trading in the Zone”
- ANYTHING can happen
- You don’t need to know what is going to happen next in order to make money
- There is a RANDOM distribution between wins and losses for any given set of variables that define an edge
- An EDGE is nothing more than an indication of a higher probability of one thing happening over another
- EVERY MOMENT IN THE MARKET IS UNIQUE
What I can tell you is that VERY FEW people pay attention to the levels and techniques shown in this post. That being said, after you do the work, how can you not?
Thanks for reading.
Twitter: @BartsCharts
Any opinions expressed herein are solely those of the author, and do not in any way represent the views or opinions of any other person or entity.


