Statistics abound showing that market corrections without recession are buying opportunities. Outside of recession, and after declines of 10%+ the S&P 500 Index is higher one year later approximately 90% of the time with an average return of 25%+ (32 corrections since 1980 – source: LPL Research).
Data also show that market corrections outside of recession around geopolitical tensions are buying opportunities. Outside of recession, only once since 1939 was the S&P 500 Index lower one year after a domestic political or geopolitical shock (29 occurrences), with a median one-year return of 13% (source: Deutsche Bank). The three occurrences where equity prices were lower one year after a geopolitical event occurred during recessions – one year after ’73 and ’74 corrections during oil embargo, and one year after the 9/11 correction.
Given the Federal Reserve is entering a hiking cycle (presumably outside recession), data show stocks rose after the start of every rate hiking cycle going back to 1953 (9 straight), gaining an average of 67% over 3.4 years to bull market peaks (source: LPL Research).
It follows then that barring a recession or outright east/west nuclear conflagration, the numbers over 80 years (and indeed since the beginning of Federal Reserve extreme intervention in 2008) favor that U.S. equity markets are currently experiencing a correction in long term secular bull market. A correction pricing in a new rate hiking cycle, eliminating stimulus fueled excesses in no to low growth equities up to megacap tech, and driving rotation into value and inflation protection including staples, commodities, and precious metals for a different, but continued bull run. However gloomy the current market correction and broader macro environment appear, barring a recession, a continued bull run is the base case.

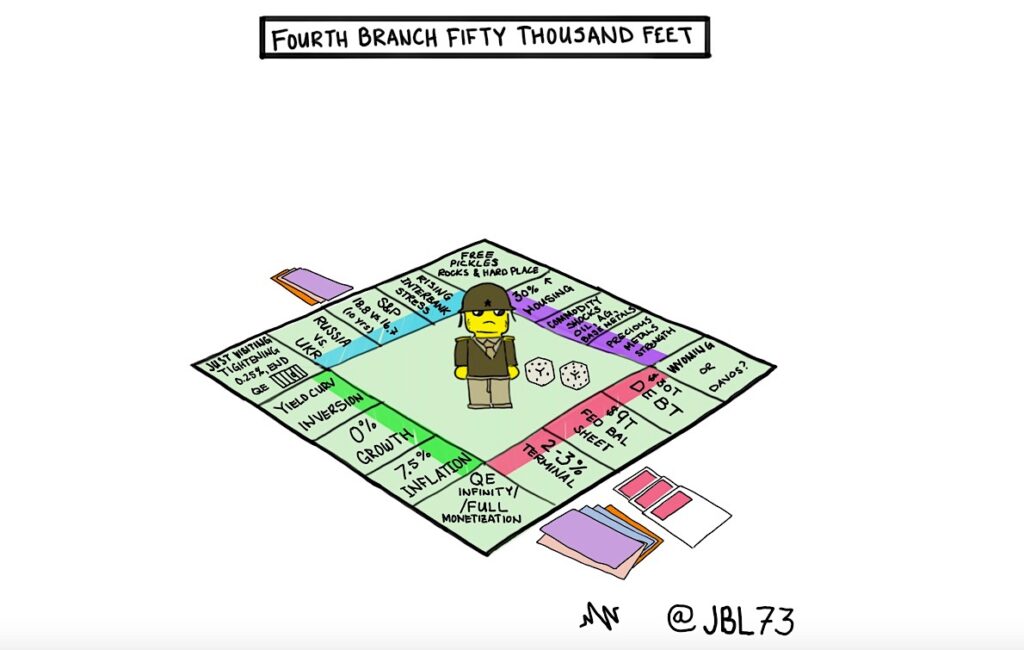
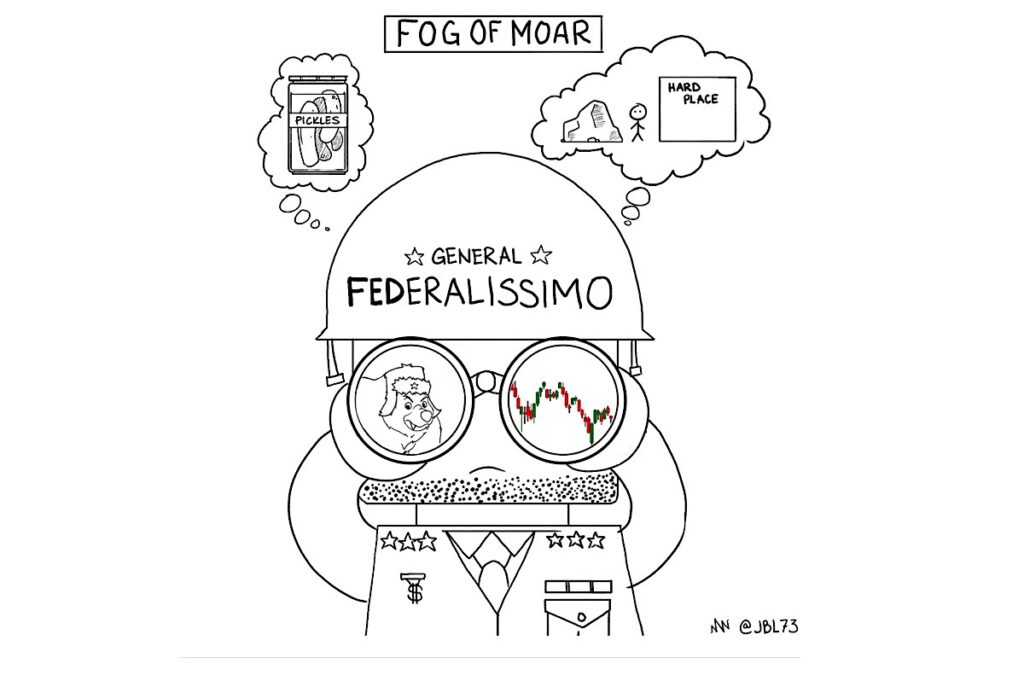
The Federal Reserve (the “Fourth Branch of Government”) is set to wind down Quantitative Easing (QE) in the next week, and start its first rate hiking cycle since 2018 on March 16th. Many argue the Fed waited too long, hanging on to its “transitory” inflation narrative to the point where it is so far behind its ahead. The Fed missed its “obvious” opportunity to tighten in mid-2021 when inflation perked up and stocks were parabolic, and now the economy is on verge of recession, requiring Fed ease even before it has even begun to tighten. As if in a fog…
In the “Fog of MOAR”, the sheer number of extraordinary conditions the U.S. economy is facing at the current time does have the Fed between a pickle and hard place. These include: (i) a 7.5% YOY increase in CPI, the highest in 40 years, with the second and third highest readings occurring in Aug. 2008 (5.4%) and Nov. 1990 (6.2%) both during recessions, (ii) the latest Atlanta Fed GDP NOW forecast for 1Q22 GDP growth at 0%, (iii) Treasury 2s-10s yield curve near inversion (previous four inversions preceded recession), (iv) the Russian invasion of Ukraine providing yet unknown interbank stress ramifications and creating and exacerbating myriad commodity shocks from crude oil to wheat to neon (2011 European debt and MENA crisis on steroids?), and of course (v) the ballooned $30 trillion in U.S. federal government debt overhang (up from $16 trillion the last time the Fed hiked in December 2018), (vi) a bloated $9 trillion Federal Reserve balance sheet the Fed desperately wants to taper, and considering all this (vii) a 2%-2 1/2% Fed funds terminal rate or natural ending forecast which at its top end much too low if high levels of inflation persist (not “transitory”). The Fed has a lid on it in its rate hiking expectations, potential runaway inflation on top of a doubling of federal debt in just three years – which it inevitably will have to “MOAR” monetize in crisis – Japanification and around the board we go…
In short, the ever trepidatious Jay Powell (after the 2018 rate hike backfire) faces an economy now estimated to be in zero percent GDP growth territory, printing the highest levels of inflation in 40 years, with a new land war in Eurasia’s breadbasket causing recession level commodity shocks around the world – all occuring in the month the he is supposed to end QE and raise the target rate for the first time in 3 years.
The last four recessions followed yield curve inversions (close now) and the largest crude oil shocks over the last 30 years have led to recession. Recession or runaway inflation are the choices. The Fed has no good options in the short run. Given this dilemma, is the Fed in the one position it can’t ease out of in 14 years? Is recession then a 50/50 proposition with the base case? Have equity markets priced in recession via the current correction in your opinion? At what levels is it priced in? Fog of MOAR indeed near term…
On the chart side, I see several things worth noting:
- 3 of the last 4 market corrections have ended essentially at or near the 200-week moving average (Feb– Mar ’20, Oct ’18 – Jan ’19, Nov ’15 – Feb ’16). That value is currently ~3400 on the S&P 500 Index just above the pre-pandemic high of 3380 and a ~30% decline from the December 2021 all time high of 4766.
- The correction of Jan-Feb ’18 was the one correction of the last 4 that didn’t decline near or through the 200-week moving average. It ended at the 50-week. This correction is in its third week below the 50-week moving average. Not propitious.
- Approximate levels of support for the S&P appear to be the 4200/4160 (April ’21 highs and recent support test level), 3970 (150-week MA), 3880 (20% bear market area), 3580 (150-week MA and Fall ‘20 highs), and 3420 (30% decline and just above pre-pandemic highs 3380).
- The VIX has been riding the upper weekly Bollinger Band for most of the past 3 months, with spikes over 30 in November, January and February, the most monthly spikes over 30 in a four-month timeframe since 2008. These feel like tremors and the weekly Bollingers look like they want to open up – portending potentially much higher volatility and lower equity markets.
Barring recession, the data say sit tight. The charts are damaged with critical support levels below in focus for possible rebound (headlines?, better inflation data, too much money too few assets?). On the other side, the VIX is “tremoring”, and the Fed faces serious choices in “The Fog of MOAR”.

Get more insights from me by signing up for my free substack.
Twitter: @JBL73
The authors may have positions in mentioned securities by the time of publication. Any opinions expressed herein are solely those of the author, and do not in any way represent the views or opinions of any other person or entity.


