After hiking rates by 5.25% since March 2022, the Fed is in a wait-and-see period, commonly deemed a pause. Since the Fed started hiking rates, inflation has declined meaningfully but remains moderately above the Fed’s 2% target. The economy continues to thrive, fueled by a strong labor market.
Despite the good news, a dark cloud lingers on the horizon. The Fed’s primary fear is that the lag effect of prior rate hikes has yet to impact the economy fully. They desire a soft landing, implying little economic degradation. But a much stronger downturn can’t be ruled out in their minds or ours. Given the odd juxtaposition between strong economic growth and recession fears, a Fed pause is the most likely action.
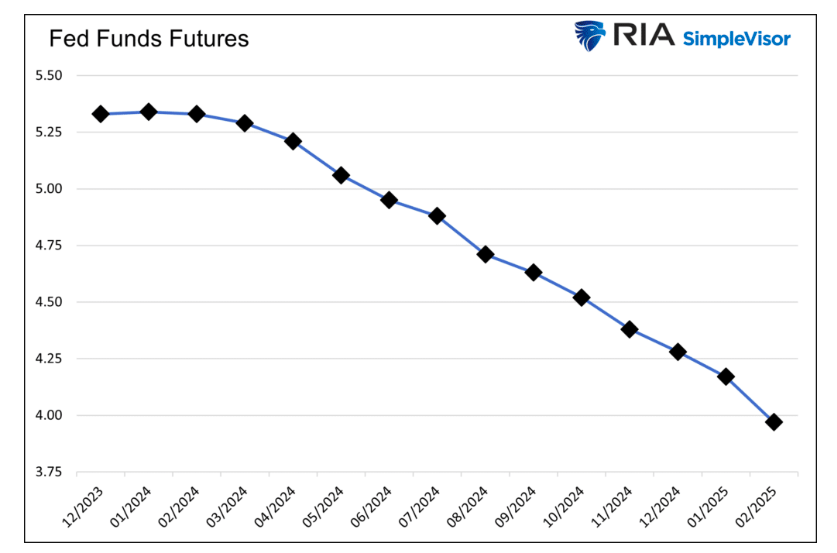
The Fed Funds futures market agrees with our assessment. As we show below, it expects the Fed to pause through February. Starting in March 2024, the market implies increasing odds of the Fed cutting rates.
If the Fed is in the pausing stage of the cycle, the logical question is how long it might last. More importantly, how might stocks and bonds perform during the pause and eventually when the Fed cuts rates?
The equity market appears to be giddy at the prospect of rate cuts, but as we will discuss, equity investors should start contemplating risk reduction strategies. Bond investors are the ones that should be giddy!
Stock Investor Giddiness Explained
The November 3, 2023, BLS employment report underwhelmed expectations. However, the bad news was good news. The stock market roared as investors presumed a Fed pause was a done deal. Since then, it has continued rising nearly 6% in only a few weeks. Bonds followed. Over the same period, the U.S. Treasury ten-year note yield has fallen by .50%.
The weaker-than-expected CPI inflation report fueled the notion that the Fed was done.
WSJ reporter Nick Timiraos, the Fed’s media mouthpiece, leads credence to the Fed pause narrative. Shortly following the CPI report, Nick tweeted the following:
“The October payroll report and inflation report strongly suggest the Fed’s last rate rise was in July. The big debate at the next Fed meeting is shaping up to be over whether and how to modify the post-meeting statement to reflect the obvious: the central bank is on hold.“
Stock and bond investors are giddy at the prospect of slower growth and lower inflation. Such outcomes are not good for equity investments. Yet logic is trumped by the hope that the Fed’s next move may be to lower interest rates.
If this rate cycle is like almost all others in the last 100 years, a Fed pause will be followed by rate cuts.
How long of a pause should we expect before rate cuts?
How Long Will A Pause Last?
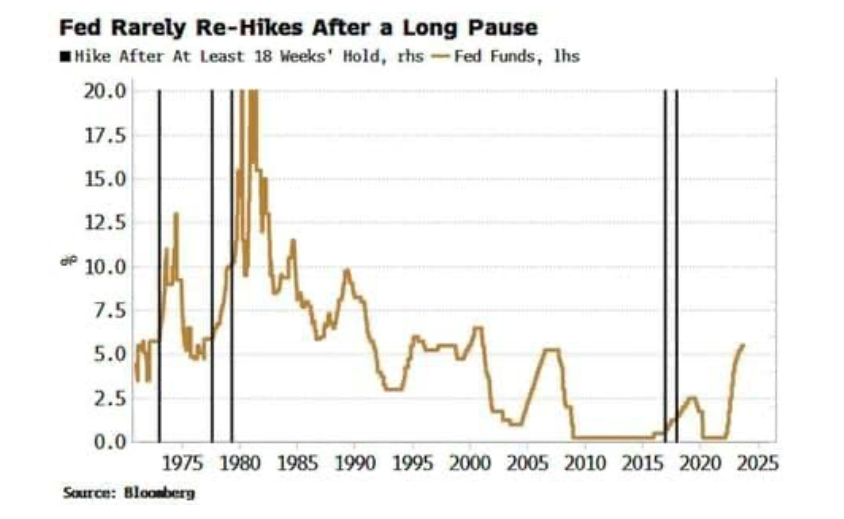
Nineteen weeks ago, on July 26, 2023, the Fed last hiked rates. The graph below, courtesy of ZeroHedge and Bloomberg reporter Simon White, shows five instances since 1970 when the Fed paused rate hikes for at least 18 weeks and resumed hiking. Only two of the cases were in the last 40 years.
In the accompanying article, Simon writes:
But when rates are already restrictive as they are today, it would be unprecedented. The longest the Fed has held rates after last hiking them, and then raising them again when rates are already restrictive – i.e., when the real Fed rate is greater than the neutral rate (using the Holston-Laubach-Williams estimate) – is 14 weeks, between August and November 1988.
No one can be 100% confident inflation will continue lower. As such, the Fed’s probability of raising rates again is not zero. However, the Fed seems more concerned that the lag effect of the prior 5.25% in rate hikes has yet to fully exert its weight on the economy. It is this dark cloud on the horizon that pressures them to pause.
The last three pause cycles since 2000 lasted 36 weeks on average. Thirty-six weeks from what may be the start of the recent pause puts us in March 2024. As we wrote in the opening, March 2024 is also the month when the Fed Funds futures market starts pricing in rate cuts.
Stocks And Bonds In Pause and Rate Cut Phases
How do stocks and bonds perform during the stages of monetary policy?
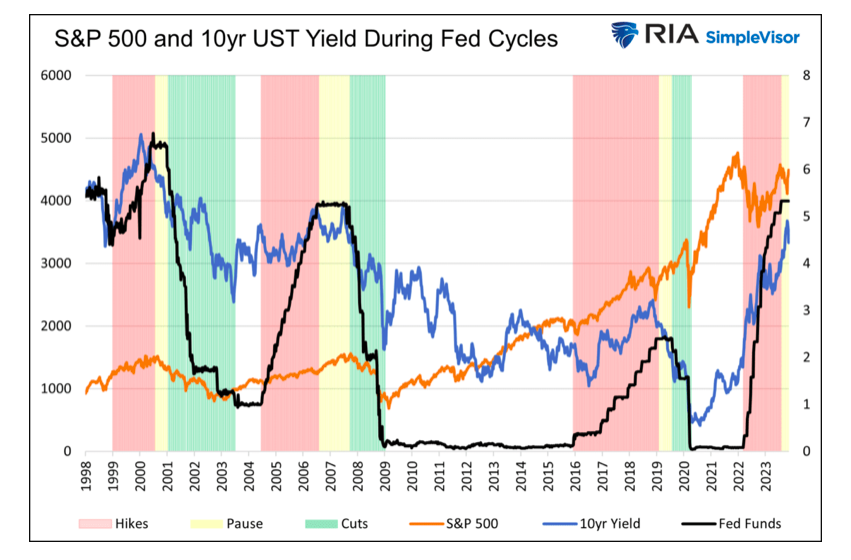
The graph below shows Fed Funds (black), the S&P 500 (orange), and 10-year U.S. Treasury bond yields from 1998 to the present. We highlight the rate hike, pause, and rate-cutting cycles with red, yellow, and green, respectively. For this article, we only consider the pause to be after the Fed increases rates.
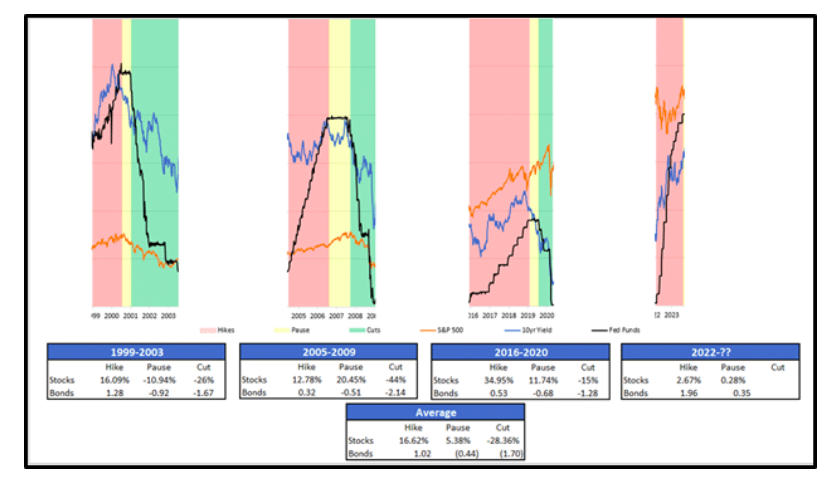
Below, we isolate the three prior and the current partial cycles to appreciate what happens during the three cycles.
Marrying Historic Returns And Logic
Stocks often do well when the Fed is hiking rates and bond yields typically rise. This occurs because the economy is running above trend, and the Fed will raise rates for fear of inflation. Their aim during such periods is to slow growth back to trend.
The economy is fueled by debt. Accordingly, higher interest rates almost always result in below-trend growth and a recession.
The term “soft landing” is often used during rate hike cycles despite their frequent occurrences. The graph below shows that a rising Fed Funds rate preceded every recession since 1950. The circles show the only instances when Fed hikes did not result in an immediate recession.
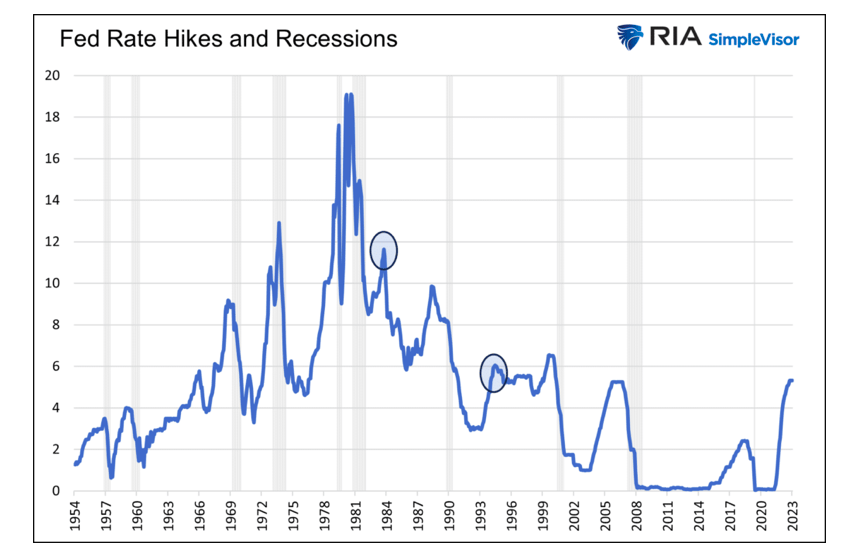
Stock performance is mixed during the Fed’s pausing cycle after rate hikes. As shown above, stocks rose decently before the financial crisis and pandemic but fell before the dot-com bust. Bond yields fall during the pause as investors anticipate slower growth and less inflation. In all three prior periods, yields fell. Currently, yields have risen during the pause but are now trending lower.
Lastly, stocks tend to perform poorly during the rate cuts, and bond yields continue to fall. Such is unsurprising as the Fed typically raised rates too much, and a soft landing turned into a hard landing.
At the bottom of the graphic are the average returns for stocks and bonds for the four periods. As shown, stocks are the investment of choice during rate increases while bond yields rise. The pause period is tricky for stockholders. Bondholders should be comforted during both the pause and the rate-cutting period. Stock investors should consider risk reduction strategies as a rate cut will likely be the next Fed move.
Summary
If history proves prescient and the Fed is genuinely pausing before a series of rate cuts, investors should consider how they might shift their exposures between stocks and bonds.
Within the equity markets, lower beta, more value-oriented stocks, and reduced equities allocations have tempered losses in past rate-cutting environments. On the other hand, bond yields may have already peaked around 5%. The current rate decline may be the tip of the iceberg if a recession is coming.
The risk to our forecast is that history doesn’t always repeat. Secondly, we have zero assurances the Fed has ended its rate hiking cycle. If the Fed raises rates again, the pause clock starts over, and stocks may do better than bonds.
Lastly, the Fed and government may panic as they did in 2020 and provide a bazooka to the equity markets via massive QE and zero interest rates. If so, any decline in equities may be short-lived. Conversely, longer-term bond yields could rise as investors now appreciate how such a massive fiscal and monetary reaction to weakness can generate inflation.
Twitter: @michaellebowitz
The author or his firm may have positions in mentioned securities at the time of publication. Any opinions expressed herein are solely those of the author, and do not in any way represent the views or opinions of any other person or entity.


