With so much attention being paid to Apple’s stock (AAPL) reaching a valuation of $2 trillion, I decided to see if AAPL’s market cap would make it into the IMF’s list of the world’s richest countries based on GDP.
In fact, it does!
Can you guess its rank?
And for a little more color on the list, which of the following countries had 2019 GDP of less than $2 trillion?
1. Italy
2. Brazil
3. Canada
4. Russia
We’ll get to the answer shortly.
The other big number this week came in Target’s (TGT) earnings release.
Target reported Q2 EPS of $3.35 which is more thatn double the consensus estimate of $1.64.
Unlike other retail announcements earlier this week, traders pushed TGT much higher.
That’s the kind of action we want to see after good news.
Nvidia (NVDA) reported its earning after the bell on Wednesday. As of 5:30 EST the news has been good but the action has been a bit disappointing. It’s too early to make a judgement, so keep an eye on this one Thursday.
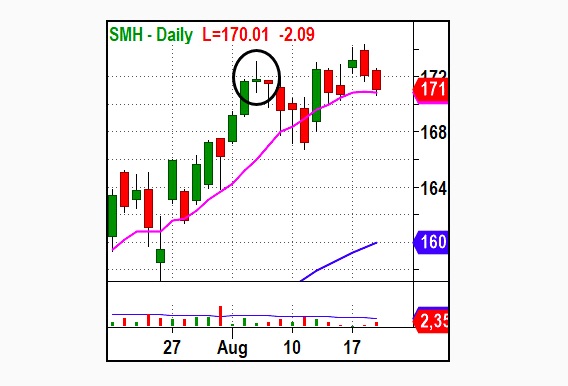
If NVDA turns weak, the Semiconductors ETF (SMH) is likely to slide, and potentially more than the bulls would like to see. Unfortunately, a subtle bearish pattern has been developing in the SMH over the last 10 days despite is leadership position.

It will be interesting to see if the rest of the stock market can hold up if there is real weakness in SMH.
Wednesday’s market seemed to be content to grind higher into new high territory until the Federal Reserve released its minutes from the last meeting.
Unfortunately, the Federal Reserve’s minutes sent the long bond ETF (TLT) significantly lower which also led to a sell off in gold and stocks.
As I highlighted in last week’s Market Outlook, the recent correlation between Gold (GLD) and TLT is worth watching if your trading either of those assets.
Additionally, the bulls in stocks don’t want to see stocks falling with falling bonds. That’s not a healthy sign for stocks. If bonds fall because of growth concerns, that should be good for stocks. Other concerns, however, may not bode well for stocks.
Gold (GLD) is pulling back and seems to have more to worry about than stocks with respect to bonds for now. Keep an eye on this market message especially if the SMH continues to get weak.
The pattern I referred to earlier in SMH is staring at you in today’s image. Notice that since the circled doji pattern…
Despite the fact that SMH has moved up, 8 of the last 10 days in SMH have closed lower than they opened. That sounds like quiet selling of a leading group to me. For now it’s consolidation, but if it moves lower, it’s distribution.
To end on a positive note, Apple (APPL) would rank #8 if its $2 trillion market cap was GDP (which it’s not, but it’s still a big number).
More interestingly, ALL four countries listed above would fall under it in the order their listed.
Market perspective is important.
Note: PDL = Prior day low, PDH = Prior day high
S&P 500 (SPY) New high but closed lower. Watch 330 as important support
Russell 2000 (IWM) Consolidation day. Key level to break above is 158, then 160 is resistance area. Sitting on the 10 DMA. 153 is key support lower.
Dow (DIA) Weak day, found support at 10 DMA. 276.50 is pivotal support
Nasdaq (QQQ) New high but closed later. 275 is pivotal area. 260 is key support level and a trendline.
TLT (iShares 20+ Year Treasuries) Sold off hard after Fed Minutes release. Resistance area is at 166. 163 next big support.
Twitter: @marketminute
The author may have a position in the mentioned securities at the time of publication. Any opinions expressed herein are solely those of the author, and do not in any way represent the views or opinions of any other person or entity.


