 By Andrew Nyquist
This past week has brought back the feeling of a falling knife. Not a good feeling, especially if you are over invested. The good news is that the markets are probably going to find a bottom soon. The bad news is that no one knows at what price. That is the $1MM question. And by far and away, that is the question that I am hearing most often from friends, family, and readers. So, where will the market find support?
Before we get to the charts and some levels to keep an eye on, let me provide you with 5 pieces of information that carry importance in understanding the summer lead up to the current state of the financial markets:
1) The European sovereign debt situation worsened and became contagious over the summer months. The PIIGS (Portugal, Italy, Ireland, Greece, and Spain) have always been a concern, but it wasn’t until July/August that the markets really hammered the debt of these nations (see: credit default swaps). This, in turn, hit the European equity markets… hard. The anxiety across Europe has grown to a light boil and social mood is only getting worse. Youth unemployment is unacceptably high in many European countries and will have dire consequences down the road if its not dealt with soon. Consumer confidence in Europe (and America) is low and the mood dreary and anxious, to say the least
2) The global slowdown started to become more apparent as China’s economic numbers slipped. This came to the forefront this week as China’s manufacturing numbers were particularly weak. Tighter policies enacted to slow lending, inflation, and the prospects of a real estate bubble have impacted economic growth. China’s markets have quietly dropped to dismal levels as well, but we haven’t heard much about this due to all the noise out of Europe. Make no mistake, though, the markets are watching China closely.
3) Many major market indices triggered a Monthly DeMark TD 9 Sell set up back in May. [If you are unfamiliar with TD analysis, I encourage you to check it out — it’s complicated, but it has a very good technical track record.] I wrote about this sell set up in June within articles like Market Uncertainties Abound and Stocks, Global Markets at Crossroads. Per the sell set up, the markets would have a 4 month period of weakness (from June through the end of September). Clearly, the markets have taken up every last ounce of that time allotment, but nonetheless the signal lasts through the end of next week. Note also that markets typically struggle during the summer months, hence the investor phrase “sell in May and go away.”
4) September tends to be one of the worst months for the markets. On the flip side, participants tend to rotate into Tech during September in anticipation of a year end rally. This has many market pundits cautiously optimistic going into year end.
5) Politics. I think we are at a point of recognition here. The Government is hamstrung by an increasingly toxic environment for spending, which is fueled by failed policies, increased public debate, and, well, A LOT of government debt; the era of intervention and artificial sweetners is coming to an end. Furthermore, Ben Bernanke and The Federal Reserve are nearly out of bullets. And that bazooka they once carried is now more like a squirt gun. This isn’t good news for Housing sector. Other to-be-affected areas that come to mind include Defense, Infrastructure/Transportation, Education, and Social/Welfare programs — and cuts to these sectors to not bode well for social mood. Medicaid and Social Security reform are bigger slices of the pie, but are probably off the table until after the 2012 elections. All in all, the markets are trying to price this in and find a bottom.
So here we are, in late September, looking for a bottom. So what are the charts telling us, and at what price might we find support and a probable bottom? To the annotated charts we go…
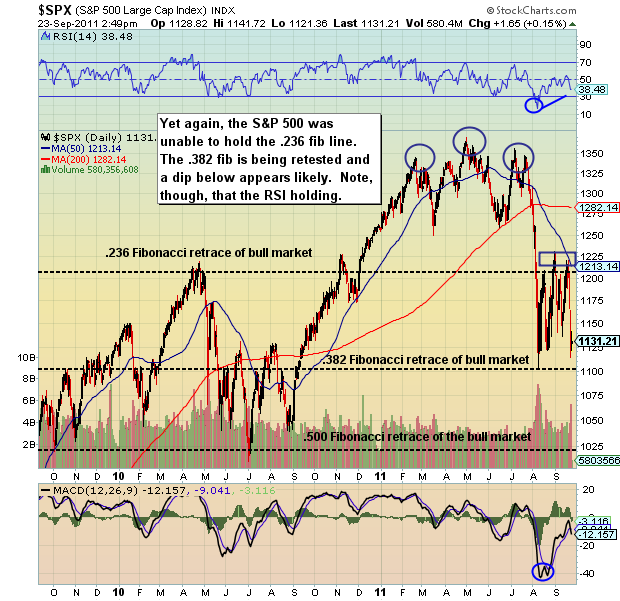
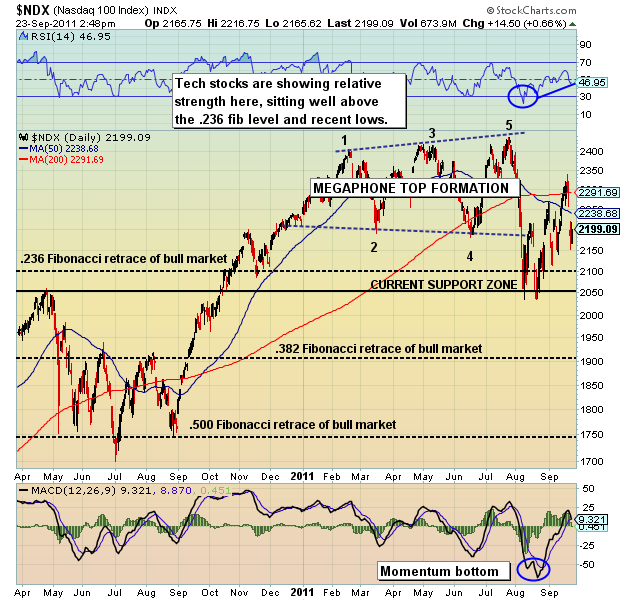
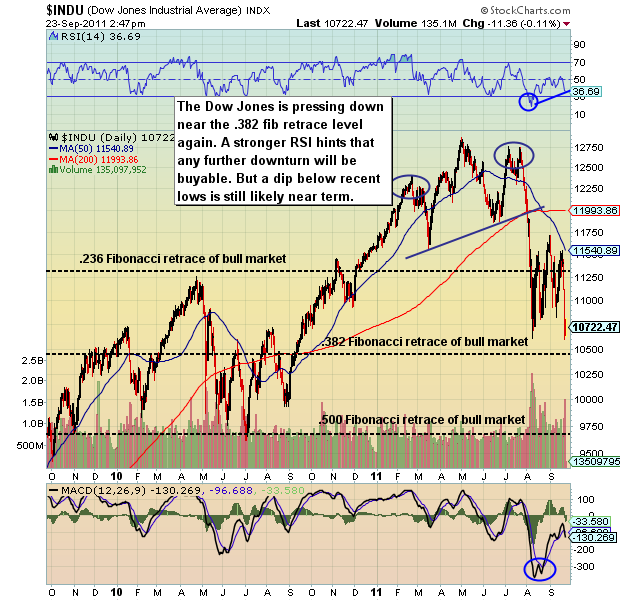
The S&P 500 is my go-to major market index for technical analysis, so I’ll start there first. Charts for the Nasdaq 100 and the Dow Jones Industrial Average follow. On the S&P 500, I’d like to think the 1102 level (.382 fibonacci support) holds or at least slows the drop, but thinking a quick dip below 1100 is likely. I am nibbling a bit here and there on select stocks, but staying cautious. Right now I am roughly 30% invested, but easy does it was my motto this week. I will start buying in earnst when/if the S&P 500 falls below 1100 (targeting 1050 – 1080) OR the markets start to show some resiliency and strength. Note that exchange-traded funds (ETFs) for each index are the SPY, QQQ, and DIA.
Note that after a big move up or down, markets often find support at fibonacci retracements (fractions/percentages of that move). For instance, the bull market from March 2009 to May 2011 went from roughly 667 to 1370 on the S&P 500. This move equated to 703 points. 38.2% of that move is 268. When you take away 268 points form 1370 you get roughly 1102, which is the current low (Aug 9) for the correction on the S&P 500. This is just one example.
In my opinion, the next week or two is pivotal. Earlier this month, I highlighted five oversold stocks to buy in September for a bounceback into year end. Next week, I’ll offer up some additional stocks I like across select sectors and investor types. Until then, have a safe and enjoyable weekend.
—————————————————————-
Your comments and emails are welcome. Readers can contact me directly at andrew@seeitmarket.com or follow me on Twitter on @andrewnyquist. For current news and updates, be sure to “Like” See It Market on Facebook. Thank you.
No positions in any of the securities mentioned at time of publication.
Any opinions expressed herein are solely those of the author, and do not in any way represent the views or opinions of his employer or any other person or entity.


