 The following is a recap of The COT Report (Commitment Of Traders) released by the CFTC (Commodity Futures Trading Commission) looking at futures positions of non-commercial holdings as of July 7, 2015. Note that the change is week-over-week.
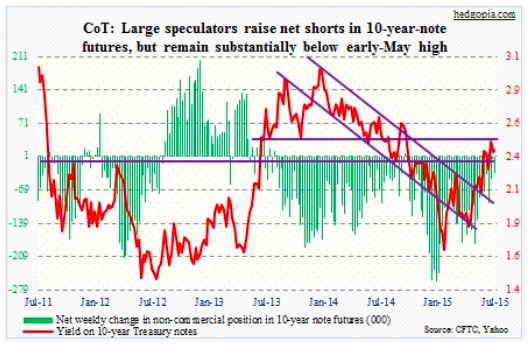
10-Year Treasury Note: After the June FOMC minutes were released, investors pushed back expectations for the first interest rate hike to March next year. The minutes were a bit more dovish than expected. Since the last meeting, the sell-off in Chinese stocks has only gotten worse. Plus, Greek uncertainty lingers. All these factors probably have the potential to push back the hawkish FOMC members who would like to move as early as September. But then, come Friday, Fed Chair Janet Yellen said she expects the U.S. economy will be ready for an interest-rate increase this year.
And then there is the IMF – at it again. For the second time, it warned the Fed that it should hold off on raising rates until 2016. It also slashed this year’s global GDP forecast from April’s 3.5 percent to 3.3 percent. For the U.S, it now expects 2.5 percent growth this year, versus 3.1 percent as early as April; Wall Street economists now expect 2.1 percent growth this year. For 2016, the IMF expects global growth to speed up to 3.8 percent. Commodities are not so sure. They are taking it on the chin – particularly in the wake of heavy sell-off in Chinese shares.
For 10-year yields to break resistance at 2.5 percent, U.S. data need to come in much stronger. Otherwise weekly momentum indicators have a ways to get before overbought conditions are unwound.
Looking at the COT report data, non-commercials added to net shorts this week, after gradually reducing them to nearly zero last week from 261,000 contracts at December-end.
Currently net short 32.7k, up 29.2k.
30-Year Treasury Bond: Next week’s major economic releases for the month of June are as follows.
The NFIB Small Business Optimism Index is scheduled for Tuesday. Member firms’ compensation and capex plans will probably draw the most attention. Both have risen from Great Recession lows, but remain subdued versus past cycles. For a year now, comp plans in particular have diverged from average hourly earnings of production and non-supervisory employees, which are stuck in the mud.
Also Tuesday is retail sales. May saw a nice jump, but momentum has been waning. In the last six months, month-over-month sales only grew in three. Year-over-year, May rose 2.7 percent, versus 1.5-percent growth in April but down substantially from five-percent increase last August.
Industrial production comes out on Wednesday. May only saw a 1.4-percent increase year-over-year. Month-over-month, activity has shrunk the past couple of months. Similarly, capacity utilization has dropped for six consecutive months, and in eight of the last 10. For what it is worth, going back five decades, only once has the Fed begun a tightening process after six straight monthly declines in utilization.
Also Wednesday is the producer price index – final demand. Friday, the consumer price index is due. Core PPI only rose 0.2 percent month-over-month in May, and the CPI 0.1 percent. Over the past 12 months, the latter rose 1.7 percent in May. This is below the Fed’s two-percent inflation target, and higher than the 1.2-percent increase in May in core PCE deflator. The latter is the Fed’s preferred gauge of inflation.
Also Friday, we get housing starts. This is a volatile series. May dropped 11 percent, preceded by a 22-percent increase in April. The 12-month rolling total, however, shows an improving trend – relatively, of course; on this basis, in each of the last six months, starts have been north of a million units.
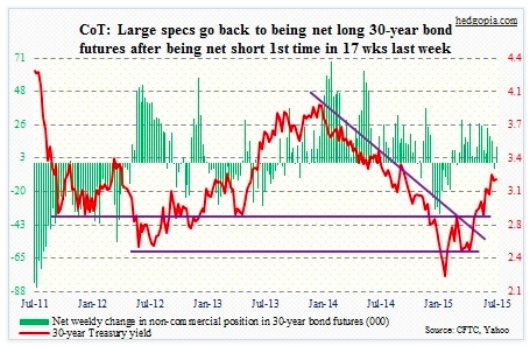
Four Fed officials are set to speak. Chair Yellen will speak twice – Wednesday and Thursday. Per the COT Report data, net longs went up by 15 thousand.
Currently net long 10.9k, up 15k.
Crude Oil: During the July 3rd week, U.S. crude production rose 9,000 barrels a day week-over-week to 9.6 million barrels a day – near the all-time high of 9.61 mb/d a month ago. At 465.8 million barrels, inventory was below the April 24th high of 490.9 million barrels, but remains elevated historically. As well, for the second straight week the U.S. oil-rig count rose, to 645 – after 29 weeks of declines.
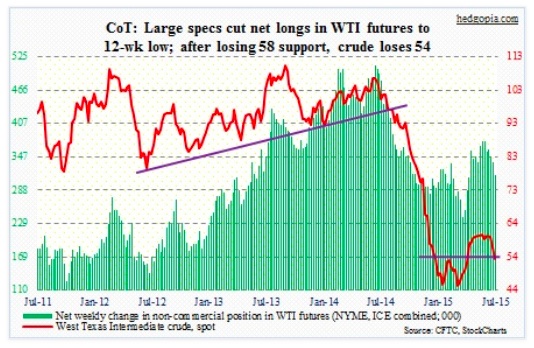
Last week, the spot West Texas Intermediate crude lost support at 58. This week, it proceeded to lose crucial 54.
In the meantime, the IEA is now forecasting that growth in global oil demand next year would slow to 1.2 million barrels a day, to 95.2 mb/d, from around 1.4 mb/d this year.
Can oil catch a break? May be. Talks on Iran’s nuclear program stalled and missed another deadline.
But the bigger question right now is, how would non-commercials react to all this? They still hold 315,000 net longs in WTI futures. For reference, in the middle of June last year as the WTI was peaking, they held 510,000 contracts. By late March, this had dropped to 241,000 contracts, which is when the crude bottomed. Currently, they have been cutting back since the high seven weeks ago, but holdings are still sizable. The longer the crude remains below 54, the more pressure they will probably come under to unwind these positions.
Currently net long 314.5k, down 23.9k.
E-mini S&P 500: U.S.-based stock funds attracted $14.1 billion in the week ended July 8 – biggest inflows since mid-December (courtesy of Lipper). Funds specializing in U.S. shares attracted $12.6 billion. SPY, the SPDR S&P 500 ETF, had a very good week, as investors poured $6.7 billion – its biggest week this year. From intra-day high to low, the S&P 500 lost 4.3 percent in the latest pullback. And investors were already itching to buy the dips. Tactically, it probably is not a bad idea.
For the major stock market index, near-Term conditions are oversold. The risk reward is getting better for bulls. At the end of June, short interest on SPY dropped 4.6 percent period-over-period, but remains relatively high.
With that said, here is something to chew over before getting overly bullish medium- to long-term. S&P Dow Jones Indices points out that in the second quarter 562 companies raised dividends, versus 696 a year ago. As well, more companies decreased their dividends – 85 versus 57 a year ago. The energy sector likely played a big role in this, but the trend is decidedly wrong.
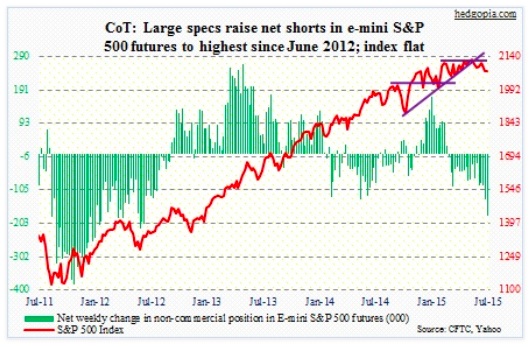
Per this past week’s COT report data, non-commercials further added to net shorts – the highest since June 2012. If bulls can regroup, these net shorts as well as short interest can act as a squeeze tailwind for stocks.
Currently net short 180.5k, up 46.3k.
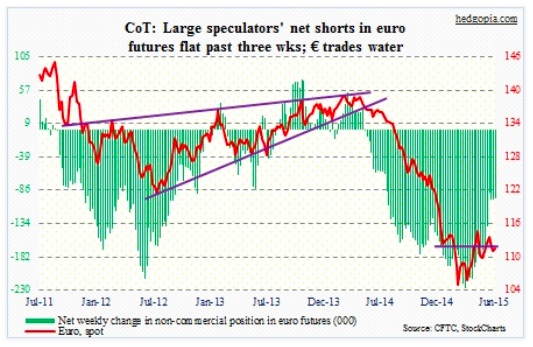
Euro: Between all the hoopla over whether or not Greece is fixed, currency traders this week voted with a ‘thumbs up’. The Euro rallied 0.7 percent for the week. Technicals probably played a role in this, as daily conditions were oversold.
The bigger question is, if Greece fails to repay a €3.5-billion bond redemption on July 20, would the ECB cut off Greek banks? Secondly, European stocks have benefited from the Draghi put. But where exactly is that put? Lower? And, in options, puts come with expiration dates.
Currently net short 99.3k, down 769.
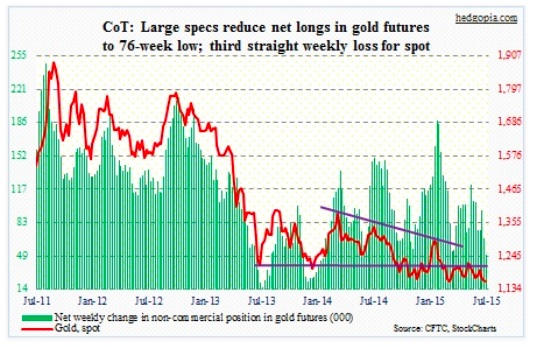
Gold: Per COT report data, non-commercials have been actively reducing net longs. Current holdings, at a 76-week low, are down 73 percent from end-January highs. Gold was just north of $1,300/ounce when these traders started to unwind back then. That took a toll on gold’s price. Then in the middle of May, they again began to unwind net longs, and that too put downward pressure on the price. So what happens to these traders’ holdings is crucial. The metal cannot afford to lose support in the $1,140s.
Currently net long 50.4k, down 16.7k.
Nasdaq 100 index (mini): With over 1.3 billion people and a rapidly rising middle class, China consumes a lot, ranging from commodities to cars to computers, among others. It probably accounts for 15 percent to 20 percent of global tech spend. In the March quarter, for instance, Apple (AAPL) sold more iPhones in greater China than in the U.S.
Enter the ongoing roller-coaster ride in Chinese stocks. The share of households owning stocks is not remotely as high in China as in the U.S. (31 percent in 1Q15). Nonetheless, a crash like the one just witnessed cannot be a confidence-booster. Time will tell to what extent that will end up impacting consumer demand. Gartner, by the way, now projects 300 million PCs being sold this year, down 4.4 percent from last year’s level.
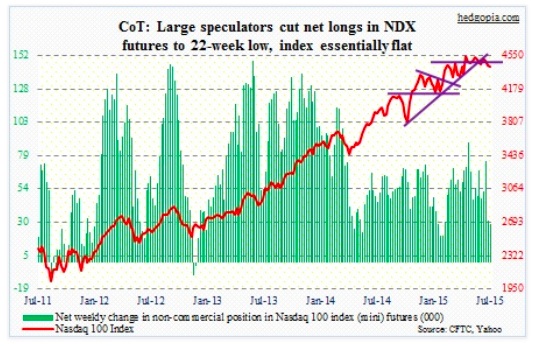
How bulls and bears react to and/or position themselves around 4480 on the Nasdaq 100 will be a big tell. There wasn’t much change in COT report data this week.
Currently net long 28.9k, down 2k.
Russell 2000 mini-index: RVX, the Russell 2000 Volatility Index, closed the week nearly 13 percent off Tuesday’s intra-day high. Friday, it found support at its 200-day moving average, but odds favor it breaks that support – potentially good news for the Russell 2000 Index.
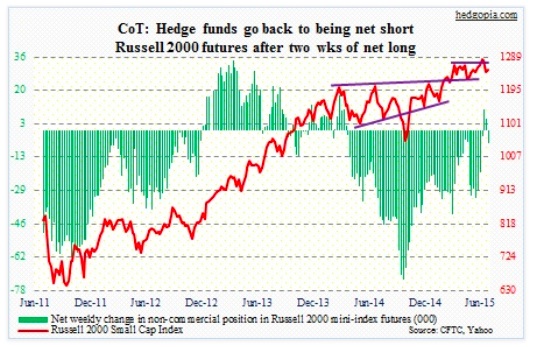
During the week, the 1210 support on the Russell 2000 was kind of tested, as it dropped to 1226 before rebounding. In the meantime, non-commercials have gone back to being net short (per COT report). Technical resistance at 1270 is an area of interest.
Currently net short 6.2k, down 11.8k.
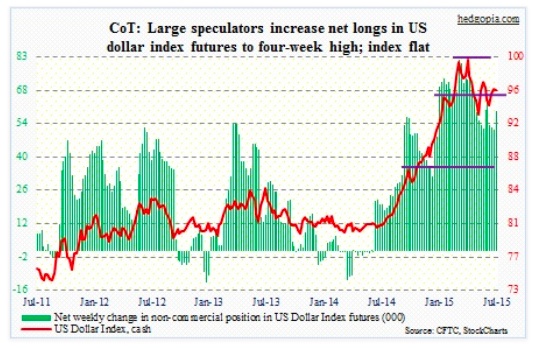
U.S. Dollar Index: On Friday, the dollar essentially treated Chair Yellen’s interest-rate commentary with a yawn. Bonds did sell off on Friday, but the greenback once again diverged.
Earlier, non-commercials added to their net longs. They probably hold the key to what happens next to the buck. Per COT report data, their net longs peaked at 81,300 contracts on March 10. The US Dollar Index peaked a week later.
Currently net long 59.4k, up 8k.
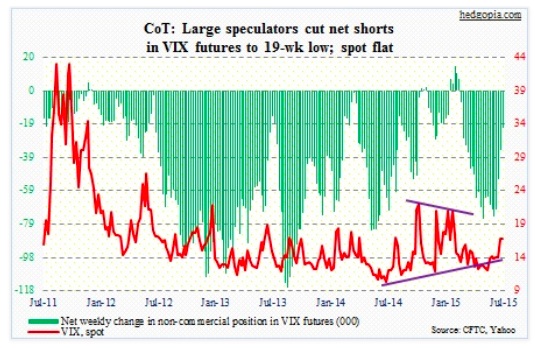
VIX: In recent sessions, Volatility Index (VIX) was in backwardation quite a few times. At extremes, this has always been a good time to go long stocks. For the second consecutive week, VIX closed way off weekly highs – another good sign for equity bulls.
A test of 15-16 probably lies ahead. This also approximates its 200-day moving average. Odds favor it gives way.
Per the COT report, non-commercials disagree with this scenario. They continue to reduce net shorts – now at a 19-week low.
Currently net short 22k, down 12.8k.
Thanks for reading.
Twitter: @hedgopia
Read more from Paban on his blog.
No position in any of the mentioned securities at the time of publication. Any opinions expressed herein are solely those of the author, and do not in any way represent the views or opinions of any other person or entity.

