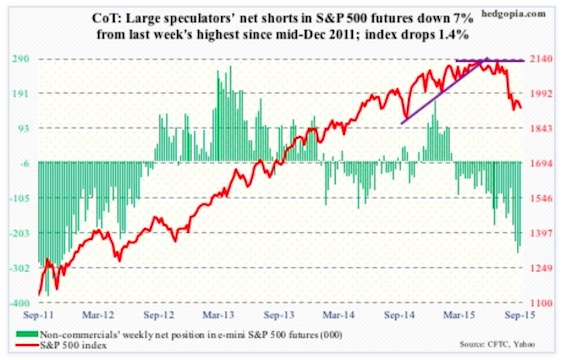
As things stand now, it is bears’ ball to lose, and they are pressing it. As of mid-September, short interest on the SPDR S&P 500 ETF (SPY) shot up 17 percent period-over-period to 437 million, and has gone up 40 percent in the past month.
This is a potential catalyst for short squeeze IF bulls are able to regroup.
This is not a scenario envisaged by non-commercials, who are staying with massive net shorts.
September 22 COT Report: Currently net short 240k, down 18.9k.
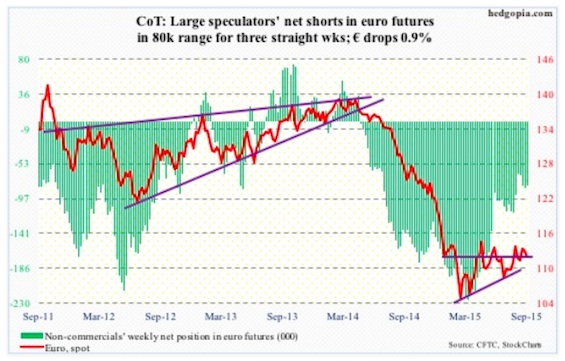
Euro: If ECB officials were trying to one up their Fed counterparts this week, they probably succeeded. Several of them spoke, each with their own take on possible expansion of stimulus. Currently, the ECB spends €60 billion/month in asset purchases, with a targeted end date of September 2016.
On Monday, ECB chief economist Peter Praet said that the bank has tools needed to anchor inflation expectations, reiterating its readiness to modify the existing bond-buying program should economic turbulence merit action. The euro dropped one percent that day.
Then on Wednesday, Ewald Nowotny, head of the Austrian central bank, said he was wary of increasing stimulus any time soon. He spoke before Mario Draghi, ECB president. The latter essentially said it was too soon to say if economic weakness warranted additional stimulus, and that the bank needed more time before deciding on further stimulus. The currency rallied 0.5 percent that day.
Non-commercials continue to lean bearish per the September 22 COT report data. Though, it’s worth noting, that they are not as bearish as they were early this year.
September 22 COT Report: Currently net short 81k, down 3.2k.
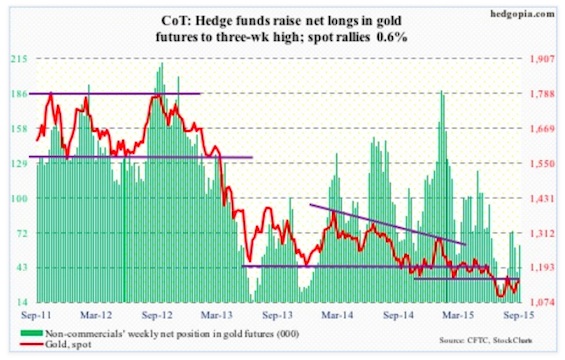
Gold: On Thursday, spot Gold rallied 2.1 percent to $1,153.30, taking out resistance at $1,140. On the Gold ETF (GLD), the corresponding resistance lies at $110, and it closed Thursday at $110.49, having risen to $110.82 intra-day. Friday was different. Interest rates rose, the dollar rose, and the yellow metal went the other way. It was not able to build on Thursday’s jump, but it is literally sitting on that resistance.
Looking at a weekly chart, there is room for it to move higher but daily momentum indicators are getting overbought. The good thing – from gold bugs’ perspective – is that the 50-day moving average is no longer dropping, and on Tuesday it provided support. On the Gold ETF (GLD), the 50-day moving average lies at $107.
Non-commercials actively added to net longs, per the September 22 COT report.
September 22 COT Report: Currently net long 61.1k, up 21.6k.
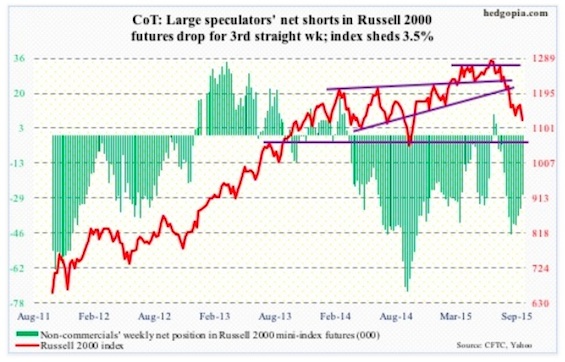
Russell 2000 mini-Index: Small-caps essentially gave a thumbs-down to the Janet Yellen speech. On Friday, the opening strength was sold right off the bat, and the Russell 2000 never got going, even as large-caps were holding their own in the early going. By nature, small-caps are domestically oriented. Is this their way of saying they would not be able to cope with higher rates? Alternatively, it is possible they simply followed the bio-techs, where early strength was sold off hard. The iShares Russell 2000 ETF (IWM) shed 1.3 percent.
Recall that last week the Russell 2000 nearly tested the broken March 2014 horizontal resistance, and was rejected.
Per the September 22 COT report data, non-commercials have been cutting back net shorts the past three weeks.
September 22 COT Report: Currently net short 27.7k, down 6.7k.
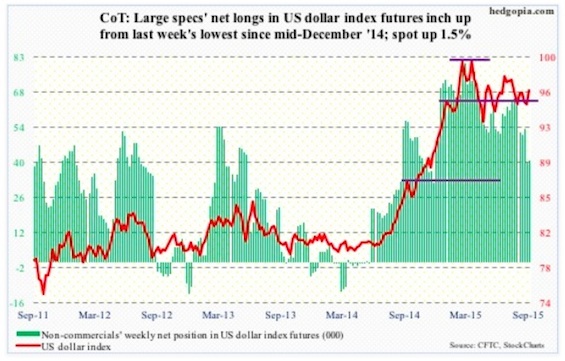
US Dollar Index: With commentary from several central bank officials during the week, the dollar index had its share of roller-coaster ride, even though it ended the week up 1.5 percent. On a daily chart, it is itching to go lower. But here is the thing. It remains trapped between 50- and 200-day moving averages, with the former beginning to decline and the latter still slightly rising. A decision time will soon be upon us.
Non-commercials are not as gung-ho as they were early this year, when they were actively adding to net longs, which peaked at north of 81,000 contracts in March. Now holdings are half that. In the past, these traders have done a good job of riding the ups and downs in the dollar.
September 22 COT Report: Currently net long 40.8k, up 1k.
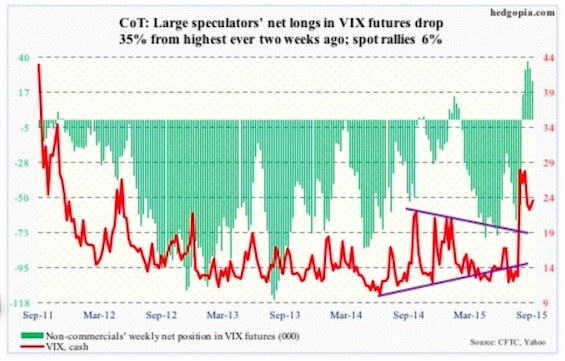
VIX: Six and counting! That is the number of weeks that spot VIX has closed above 20. Yes, it has been more than cut in half from the August 24th high of 53.29, but it continues to attract bids north of 20. This has to dishearten equity bulls. Consolation: Non-commercials have been cutting back net longs the past couple of weeks.
September 22 COT Report: Currently net long 24.8k, down 8.3k.
Thanks for reading.
Twitter: @hedgopia
Read more from Paban on his blog.
No position in any of the mentioned securities at the time of publication. Any opinions expressed herein are solely those of the author, and do not in any way represent the views or opinions of any other person or entity.

