The following is a recap of The COT Report (Commitment Of Traders) released by the CFTC (Commodity Futures Trading Commission) looking at futures positions of non-commercial holdings as of August 18, 2015. Note that the change is week-over-week.
10-Year Treasury Note: The Fed is in a fix. For a while now, the Federal Reserve has been expressing its desire to at least begin a rate-tightening process this year – if economic data cooperate. Forces – both internal and external – are not going along.
Of the Federal Reserve’s dual mandate – employment and price stability – more progress has been seen on the jobs front than on inflation. If the Fed moves in one of the three remaining meetings this year, it would have embraced the former, and given the cold shoulder to the latter.
This has now been further complicated by what is happening outside the U.S.
As the central bank of the most prominent reserve currency, it is probably hard for the Federal Reserve to completely tune out overseas developments. This week’s FOMC minutes probably lean a little dovish. Since that July 28-29 meeting, China has devalued its currency, already leaving behind a trail of aftershocks. Commodities and emerging market stocks and currencies have taken another leg lower, with the Malaysian ringgit and Indonesian rupiah, for instance, making 17-year lows. Vietnam devalued the dong and Kazakhstan the tenge.
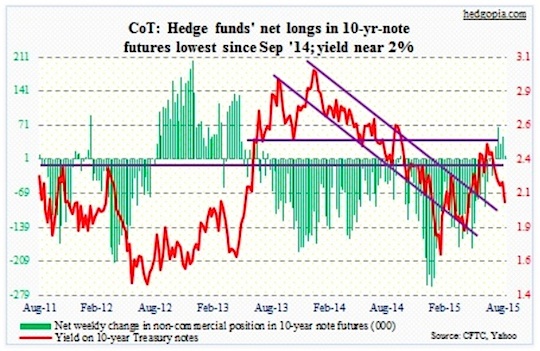
Bonds continued to rally this week. They continue not to buy the rate-hike narrative. They are more in line with, let us say, copper and oil, which are sending wrong vibes about global growth prospects.
Per COT report data, non-commercials cut net longs to the lowest since September last year, and are likely driven by technicals. The iShares 20+ Year Treasury Bonds ETF (TLT) is way overbought in the near- to medium-term.
The COT Report: Currently net long 7.3k, down 40.5k.
30-Year Treasury Bond: Here are the major economic releases next week.
New home sales for July come out on Tuesday. June was down 6.8 percent over May. Four out of the last six months, sales have come in north of 500,000, with the 12-month rolling average of 484,000 in June – the highest since November 2008. On Thursday, the pending home sales index for July is published; in June, it dropped two points to 110.3.
The advance report on durable goods for July is released on Wednesday. Year-over-year, orders for durable goods have fallen for five consecutive months and in seven of the last eight. Orders for non-defense capital goods ex-aircraft have lost momentum as well, down for five consecutive months.
The second estimate of 2Q15 GDP is out on Thursday. Real GDP grew 2.3 percent during the quarter, and 1Q was revised to 0.6 percent from a previous negative reading. We also get the preliminary estimate of second-quarter corporate profits. Profits (adjusted for inventory valuation and capital consumption) were $2.01 trillion in the first quarter, having peaked at $2.16 trillion in 3Q14.
On Friday, July’s personal income is released. Traders will be keenly eyeing the PCE deflator. This is the Fed’s favorite measure of inflation, and has been coming in weaker than the CPI. The last time it grew at an annual rate of two percent was in April 2012.
Dennis Lockhart, the Atlanta Fed president, speaks on Monday. And Jackson Hole begins on Thursday; Federal Reserve Chair Janet Yellen is skipping this year’s conference.
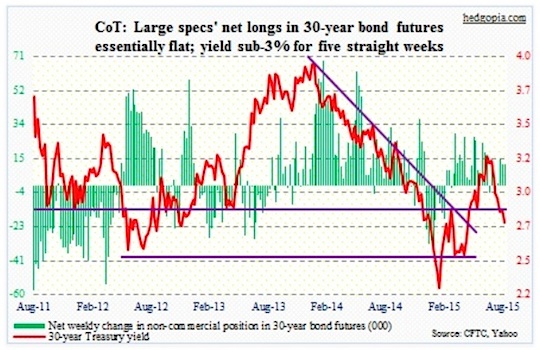
The COT Report: Currently net long 11.8k, up 163.
Crude Oil: U.S. oil stocks rose 2.6 million barrels in the August 14th week to 456.2 million barrels. Stocks at Cushing, OK, were up 326,000 barrels to 57.4 million. Production fell 48,000 barrels per day to 9.35 mbpd; the most recent high was 9.61 mbpd in the June 5th week. U.S. oil production is hanging in there.
None of the three major producers – Russia, Saudi Arabia, and the U.S. – is backing down. Citigroup points out that Saudi Arabia’s cost of production is less than $10 a barrel (even though its fiscal breakeven price is much higher). Russia also has some production under $10. In U.S. shale, costs are varied, with a cluster of production in the $30/barrel area.
Some oil producers are beginning to feel the pain. Spreads on Venezuelan five-year credit default swaps are at their highest since the financial crisis. The Nigerian naira is down 20 percent over the last 12 months, as are its foreign reserves.
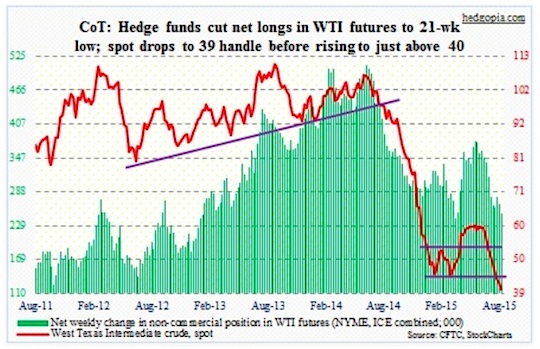
The week brought no reprieve. Spot West Texas Intermediate crude oil dipped below $40 before ending the week at $40.29.
Non-commercials cut net longs to a 21-week low, per COT report data.
The COT Report: Currently net long 250.1k, down 16.2k.
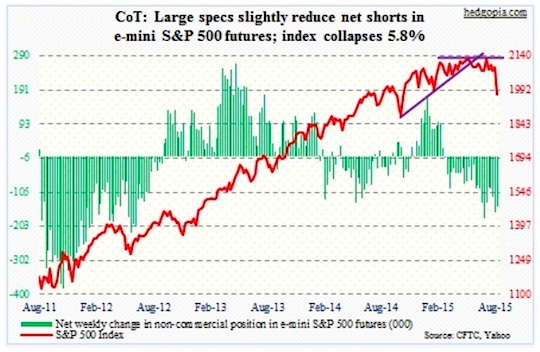
E-mini S&P 500: Risk happens fast. That was the lesson this week for global stocks. After weeks of technical deterioration, narrow market leadership, transports not able to rally despite drop in oil, widening credit spreads, and tightening Bollinger bands, among others, the S&P 500 held its own. Until Tuesday. It was like someone flipped a switch. Suddenly, there was a rush of sell orders trying to exit through a narrow passage. The index lost 5.8 percent for the week. In the process, the six-month range has been resolved to the downside. There is now resistance at the 2040 range.
Just to compare this sell-off with the one last September/October, there was no monthly MACD crossover back then, and there was no risk of death cross.
The Bank of America Merrill Lynch’s latest global fund manager survey showed fund managers’ exposure to U.S. stocks stood at a 14 percent net underweight position. Is this week’s pullback enough for them to start nibbling? Or will they be waiting for more? This will have obvious repercussions.
The past five years, corporate buybacks have been the most reliable source of funds, and in all likelihood will be less so going forward, given that corporate earnings are decelerating/declining. At $111.88 (as of the 20th), 2015 operating earnings estimates for S&P 500 companies are lower than $113.02 last year.
Per the COT report, non-commercials reduced net shorts, but still have sizable exposure.
The COT Report: Currently net short 146.6k, down 15.8k.
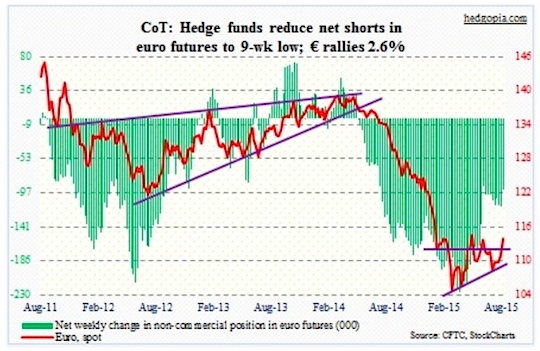
Euro: Fitch upgraded Greek debt to CCC from CC on third European bailout. Greece is no longer a source of negative headlines – for now. The euro rallied for the second straight week, and has room to rally further on a weekly chart. Off the March lows, the currency has rallied nearly nine percent. In the face of renminbi devaluation, how long before the ECB tries to jawbone the euro down?
The COT Report: Currently net short 92.7k, down 22.5k.
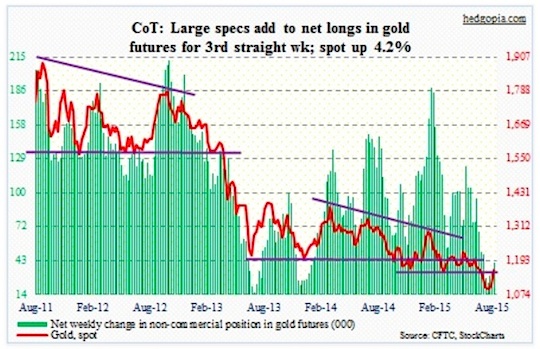
Gold: A strong week for gold prices – up four-plus percent. The metal was a beneficiary of the risk-off attitude in the markets, slicing through resistance at 1,140. The next one lies at the 1,180 range, and this may prove to be tougher.
Gold is beginning to look overbought on a daily chart, but has room to run medium-term. The key is what happens when/if it drops to its 50-day moving average (1,137), which approximates the afore-mentioned resistance-turned-support at 1,140. Action so far is healthy. Along the same lines, the SPDR Gold ETF (GLD) filled the July 20th gap with ease.
Gold probably needs a breather.
In the meantime, for the third straight week the COT report is showing non-commercials adding to net longs. This is what gold bugs want to see happen.
The COT Report: Currently net long 41.7k, up 9.2k.
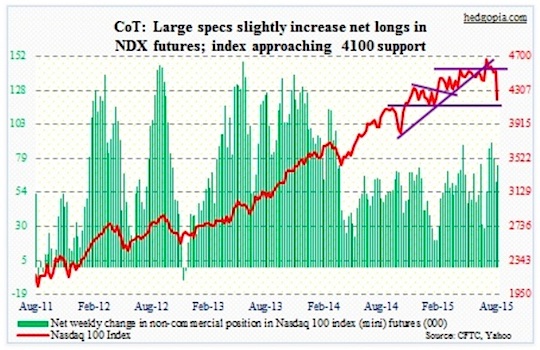
Nasdaq 100 index (mini): Before this week, non-commercials cut back net longs by 31 percent, and were right to show caution. With that said, net longs are still much higher than six or seven weeks ago. This week, they added a little, and paid the price. Wednesday through Friday, the index dropped 7.6 percent. There is good support at 4100.
Longer-term, the 8.5-percent drop in August has done a lot of damage. The Nasdaq 100 now has a monthly MACD crossover.
The COT Report: Currently net long 73.9k, up 12.1k.
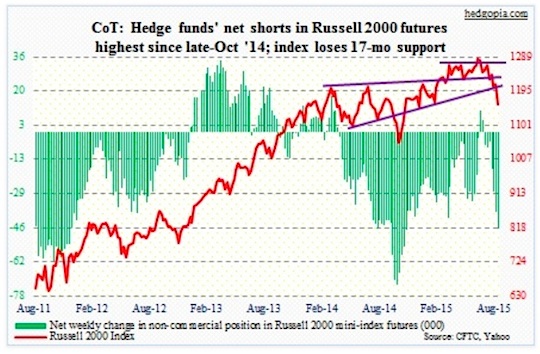
Russell 2000 mini-index: Non-commercials nailed it! In the past four weeks, their net shorts went from 4.5k to 46.1k. The Russell 2000 dropped just under eight percent during the period. Major support at 1210ish is now gone. In the days ahead, a daily death cross seems imminent. On the iShares Russell 2000 ETF (IWM) corresponding support lies at 118.
Nonetheless, if Friday is a sign of things to come, when stocks stabilize, money likely gravitates toward small-caps. The Russell 2000 Volatility Index (RVX) closed near the session high on Friday. However, the Russell 2000, though it was down 1.2 percent, almost produced a long-legged doji. In contrast, both the S&P 500 and the Nasdaq 100 produced solid red candles.
The COT Report: Currently net short 46.1k, up 7.9k.
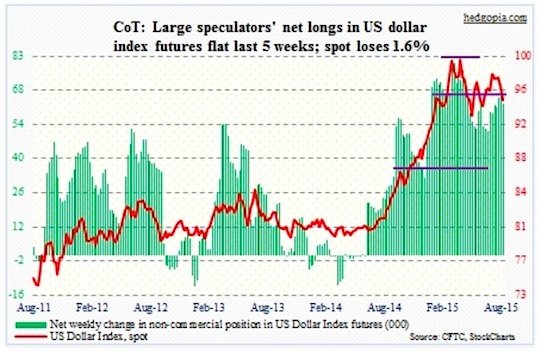
US Dollar Index: The dollar fell post-FOMC minutes, and continued to come under pressure the next two sessions. It is interesting the dollar index could not rally in a risk-off week, falling 1.6 percent. The Bank of American Merrill Lynch survey also points out that fund managers have reduced exposure to commodities and emerging market equities to record lows this month. The greenback has not benefited from this. The dollar index is down 2.5 percent for the month. Is this some kind of a tale-tell?
Non-commercials’ net longs have essentially gone sideways in the past five weeks of COT report data. The dollar index rallied 26 percent between July last year and March this year. It is in need of digestion. There are tons of overbought conditions remaining to get unwound in the medium- to long-term. Though on a daily chart, it is approaching the 200-day moving average; 50-day is right above.
The COT Report: Currently net long 62.9k, down 2.6k.
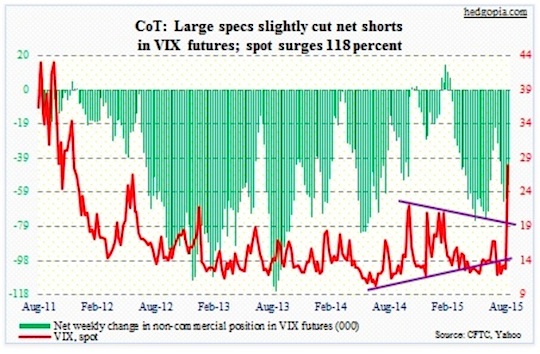
VIX: One look at the chart below, and it is easy to see how volatile the week was. As far as volatility bulls are concerned, spot VIX ended on a strong note, pretty close to the highs. This thing has not yet flashed a spike/reversal signal. Although, when one looks at certain NYSE metrics on Friday, it is beginning to feel like a washout – there were zero 52-weeks highs, versus 627 lows; down volume was 93 percent.
As well, the VIX to VXV ratio ended the week at 1.19, highest since October 2008. But before we consider this as a buy signal, let us consider how things progressed back then. The ratio progressively rose from 1.17 (September 22) to 1.21 (September 29) to 1.37 (October 6) to 1.38 (October 13) to 1.43 (October 20).
The point is, VIX:VXV can always move higher from these levels. We just don’t know. But once it stabilizes and begins to drop, that is when stocks get a tailwind.
The COT Report: Currently net short 54.9k, down 7.6k.
Thanks for reading!
Twitter: @hedgopia
Read more from Paban on his blog.
No position in any of the mentioned securities at the time of publication. Any opinions expressed herein are solely those of the author, and do not in any way represent the views or opinions of any other person or entity.

