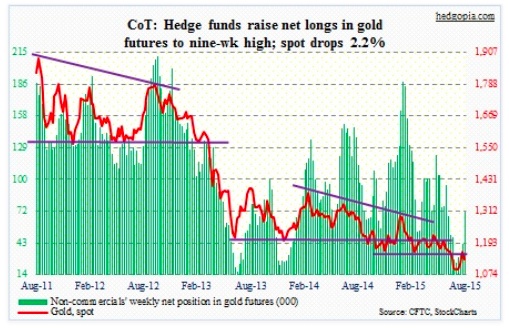
Looking at the COT report, it’s important to note that non-commercials in Gold continue to add to net longs, which have gone up by 46,000-plus in the past month.
COT Report Data: Currently net long 70.7k, up 29.1k.
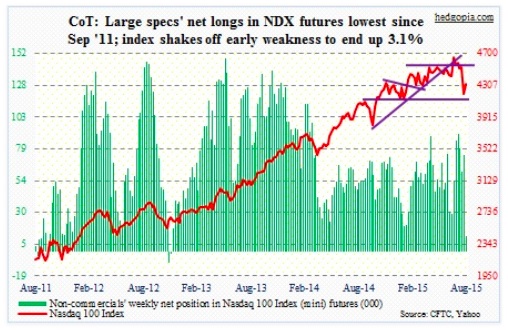
Nasdaq 100 Index (mini): During the week, the index traveled 553 points! At its worst, it was down nearly 10 percent, but ended the week up 3.1 percent! In the process, the weekly chart has produced a high-volume solid white candle. The index is right underneath resistance currently. The 200-day moving average is only 54 points away.
Non-commercials continue to lean cautious, however, having cut back net longs to a nearly four-year low. For whatever it is worth, Apple (AAPL) just suffered a death cross.
COT Report Data: Currently net long 11.4k, down 62.4k.
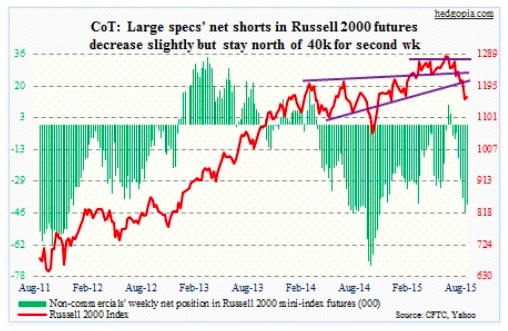
Russell 2000 mini-Index: During the first three sessions this week, the ratio of the Russell 2000 Volatility Index (RVX), to the S&P 500 Volatility Index (VIX), went below parity. RVX only goes back nine years, but in the past the ratio has shown a tendency to trade near/under parity near bottoms. Will it work this time?
Per COT report data, non-commercials maintained their net short exposure – north of 40,000 – for the second week running.
COT Report Data: Currently net short 41.4k, down 4.7k.
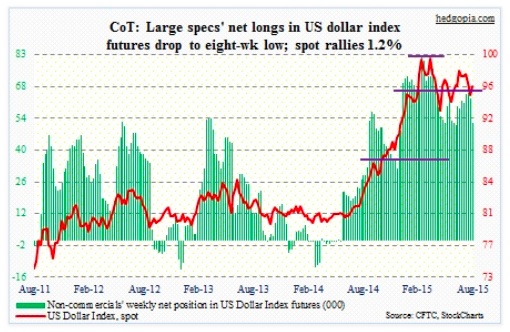
US Dollar Index: On Monday, when there was a bloodbath in equities, the US Dollar failed to act as a safe haven. At one point that day, the US Dollar Index was down 2.6 percent – a huge daily move for any currency. Maybe because it lost its 200-day moving average, then becoming a self-fulfilling prophecy. The remaining four sessions, the dollar rallied, and is now back above that moving average.
Non-commercials continue to lose faith. Since peaking at just north of 81,000 early March this year, the COT report shows net longs down 36 percent.
COT Report Data: Currently net long 52.2k, down 10.7k.
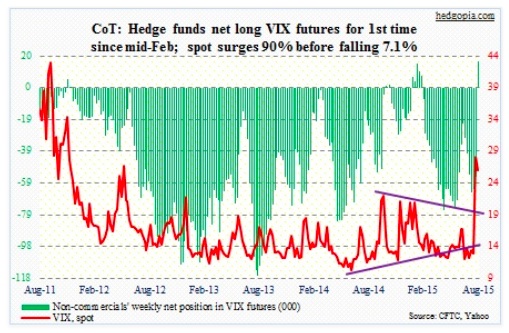
VIX: In a quiet market when futures are in contango, selling downside puts makes sense. It is a popular way to earn premium. In an environment in which the VIX spikes, these puts begin to attract bids, as traders begin to price in a VIX reversal. This unfolded particularly on Thursday as front-month puts were being gobbled up left and right. So far this strategy in volatility has paid off.
As spot VIX was spiking, VIX futures never believed the spike was permanent.
The thing to watch going forward is if the VIX manages to stay above 20 next week, and maybe the week after. That will be worrisome. It has been over 20 for two straight weeks, and trending higher. The ideal scenario for equities is if the air continues to come out.
Per recent COT report data, non-commercials are betting on an elevated VIX scenario. They went net long – for the first time since mid-February.
COT Report Data: Currently net long 16.8k, up 71.7k.
Thanks for reading!
Twitter: @hedgopia
Read more from Paban on his blog.
No position in any of the mentioned securities at the time of publication. Any opinions expressed herein are solely those of the author, and do not in any way represent the views or opinions of any other person or entity.

