Why does Warren Buffett continue to hold a massive stake in Apple?
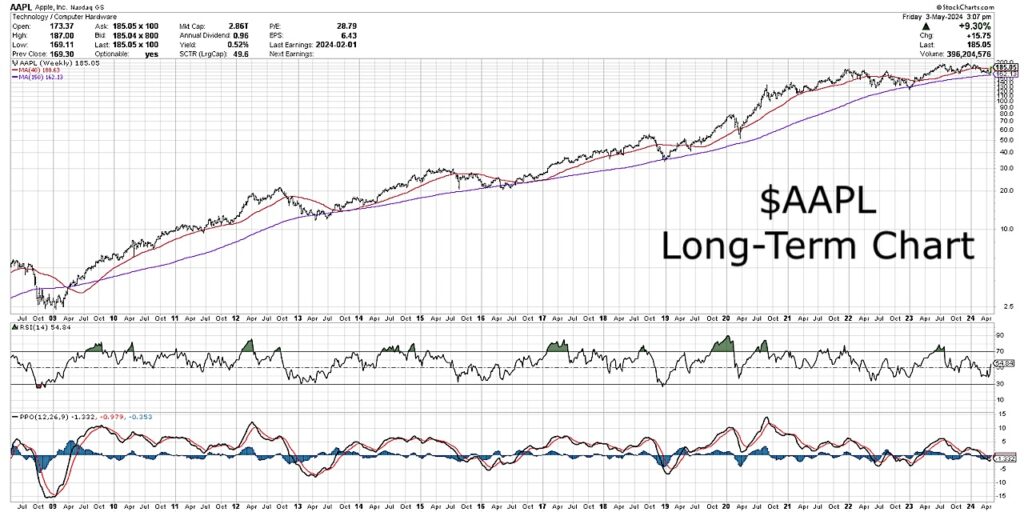
From a technical perspective, it’s because this is a stock that continues to show strong long-term momentum characteristics, with pullbacks to an ascending 150-week moving average often serving as perfect entry points.
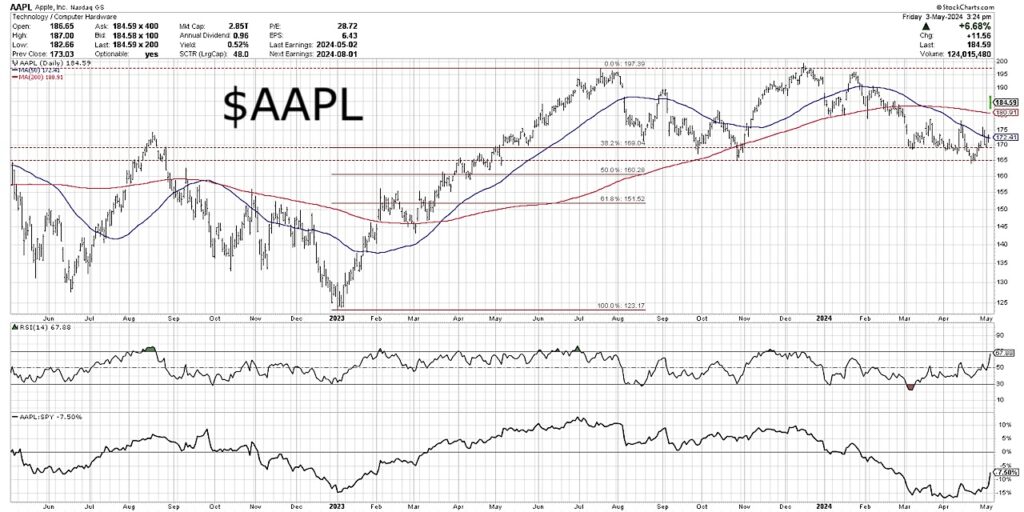
Using multiple time frame analysis, we can relate the short-term movements in AAPL to the medium-term rangebound pattern. We can then focus on the long-term uptrend that has defined Apple over the last 5-10 years.
In today’s video, we’ll use multiple time frame analysis to show why the recent pullback may set up the next big move higher. Will AAPL continue its long-term bullish phase, and what would help us confirm this is the case in 2024? (See additional Apple $AAPL stock charts below)
- Apple gapped higher last week after their earnings call where they announced new plans to buyback shares. What key levels are in play after that gap higher?
- How can we define the medium-term trend for AAPL, and what triggers could signal a change in that medium-term pattern?
- Which moving averages on the weekly chart can help us understand the long-term price appreciation that has defined Apple from a technical perspective?
Video: Is Apple’s Stock Ready To Rally?
$AAPL Charts: Fibonacci Analysis + Long-Term Price Performance


Twitter: @DKellerCMT
The author may have positions in mentioned securities at the time of publication. Any opinions expressed herein are solely those of the author, and do not in any way represent the views or opinions of any other person or entity.


