Texas Instruments (TXN) traded 7% lower on Wednesday morning, after posting earnings that beat Wall Street expectations but missing on revenue.
The semiconductor manufacturer reported earnings per share of $1.58 and total revenue of $4.26 billion, compared to analyst estimates of $1.53 and $4.30 billion. As well, Texas Instruments earnings included guidance that came in below the average analyst estimates for both earnings and revenue.
CEO Rich Templeton described the situation clearly, “Revenue increased by 4 percent from the same quarter a year ago, however demand for our products slowed across most markets.” The Market Vectors Semiconductor ETF (SMH) was down nearly 4%, indicating the lack of demand was sectoral in nature.
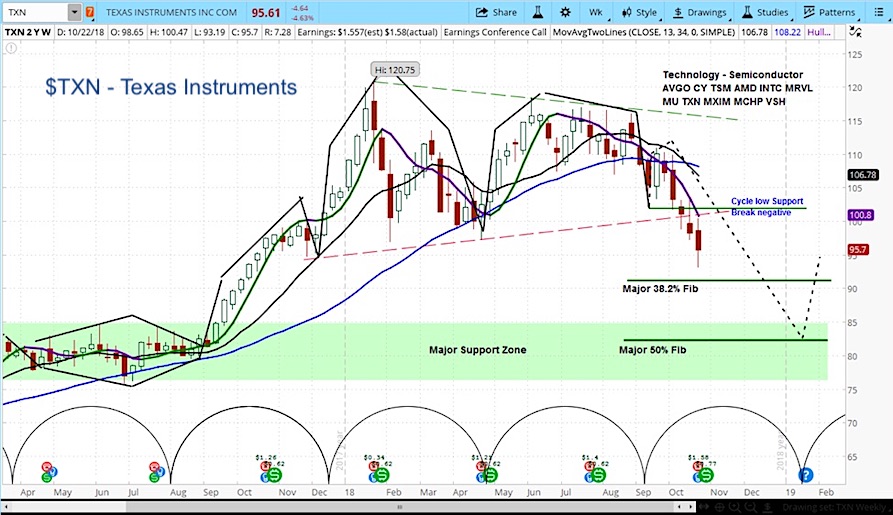
In analyzing TXN market cycles on the chart below, we can see that the stock has fallen below the price at which it started the cycle.
This is called a cycle breakdown and the odds are high that it will end the cycle lower. We also note the pennant formation, which is now broken.
Our projection is to hit $83 by January, and then to bounce as this negative period completes and a new cycle begins.
Texas Instruments (TXN) Stock Chart with Weekly Bars
For more from Slim, or to learn about cycle analysis, check out the askSlim Market Week show every Friday on our YouTube channel.
Twitter: @askslim
Any opinions expressed herein are solely those of the author, and do not in any way represent the views or opinions of any other person or entity.


