One of the most controversial people in the controversial news cycle is Elon Musk. Whether it is Twitter, Tesla, or his thoughts on world events, it seems writers are chalk full of things to write about.
Today, we look at his tech prize bellwether, Tesla (TSLA).
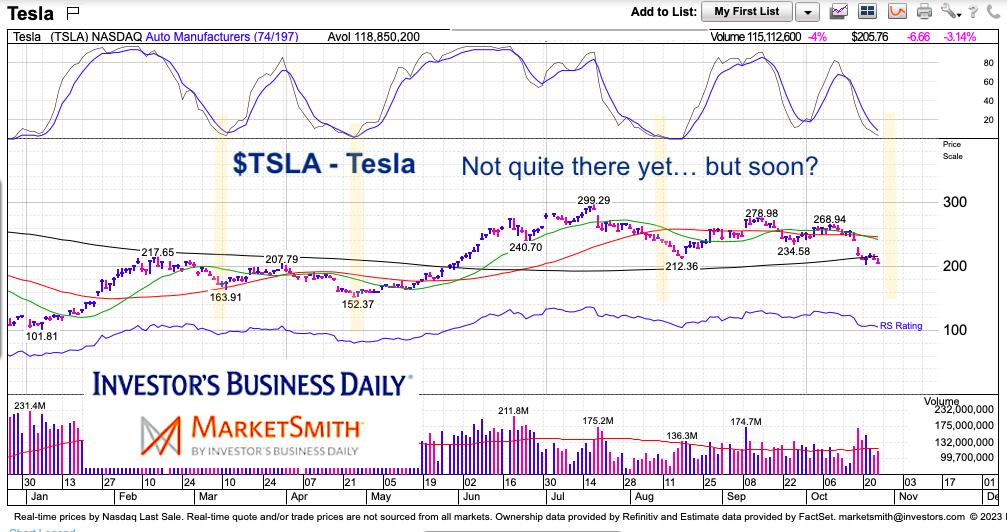
Similar to his headlines, Tesla’s stock has been very volatile. From $100 to $300 back to $200… big stock price swings have overwhelmed active investors.
The latest swing lower has seen TSLA’s momentum reach lows not seen since August. Seems that when the fast momentum line nears 0, TSLA is nearing a bounce.
Note that the following MarketSmith charts are built with Investors Business Daily’s product suite.
I am an Investors Business Daily (IBD) partner and promote the use of their products. The entire platform offers a good mix of tools, education, and technical and fundamental data.
$TSLA Tesla Stock Price Chart
If the latest selloff mirrors recent selloffs then we should see the stock price begin to find a tradable bottom soon and bounce. Understanding that the past does not determine the future, we should be prepared for the potential of a weak bounce. Therefore, it’s probably wise to chart TSLA’s relative performance to QQQ to gauge the strength of any bounce.

Twitter: @andrewnyquist
The author may have a position in mentioned securities at the time of publication. Any opinions expressed herein are solely those of the author, and do not in any way represent the views or opinions of any other person or entity.


