 By Andrew Nyquist
Everyone seems to have a take on Gold and Silver these days. From government debt to a weak dollar/inflation to debt destruction/deflation… it’s a highly political and opinionated space that catches both sides talking a long term book on a daily basis. And although both sides make sound arguments about where the price of said precious metals may be heading, it’s often on a time continuum that may not be today’s business [price-wise].
Why? Because commodity prices have not, and often do not, move in a straight line (see definition of volatility). Take the past year for example, very bumpy and downward sloping. But money was made on both sides. So if bulls or bears are concerned about making an entry into the space for a short term trade or longer term investment, they need to be aware of the volatility, as well as the technical price support and resistance levels. Nobody wants to overpay, and everyone wants to make money.
I often write about technical levels because I think it’s important for traders and investors to understand that if you do your technical and fundamental homework (and apply a little patience), you can firm up an investment plan that minimizes risk by highlighting where to buy (into support) and where to sell (into resistance). And whether one chooses to focus on near or long term technical charts is a product of your investment time frame and risk profile.
I’ll let the charts speak for themselves, but I’ll share a few bullet points prior to the charts:
Gold & Silver
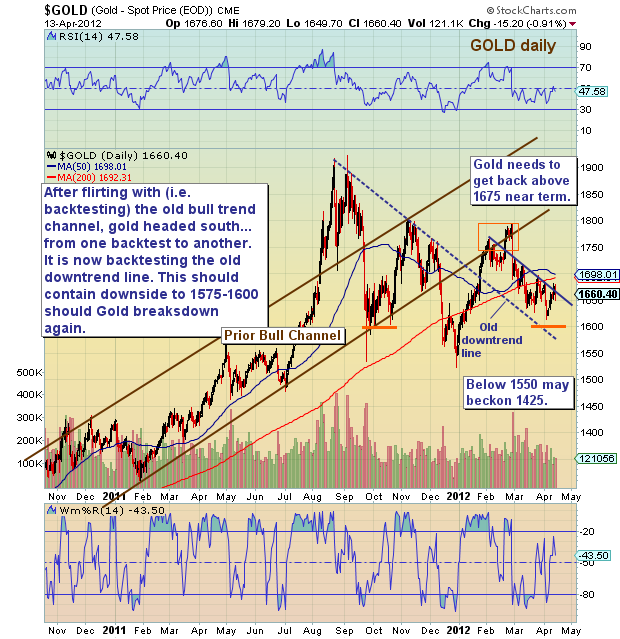
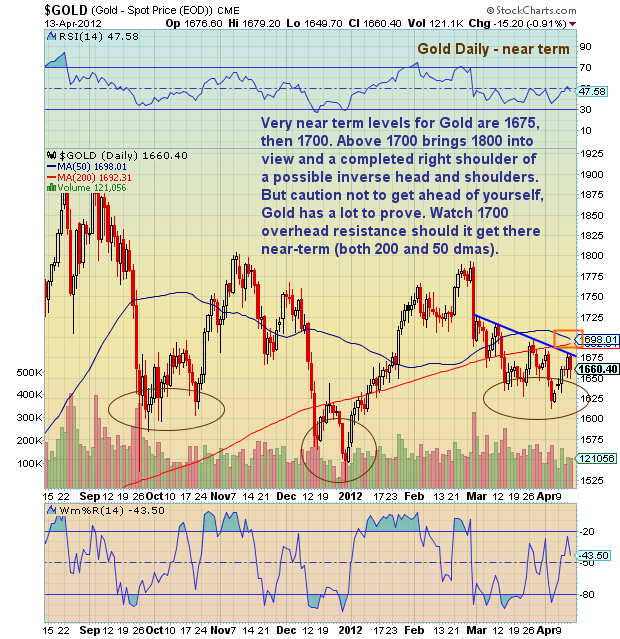
-Unenthusiastic move through 1665 for Gold last week, closing the week at 1660. Resistance overhead at 1675-80, then 1700, then 1790. Support below at 1650, then 1625, then 1575-1600.
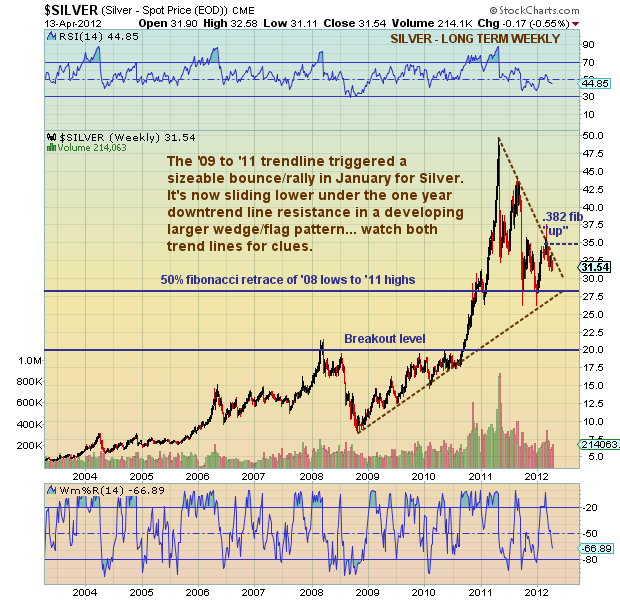
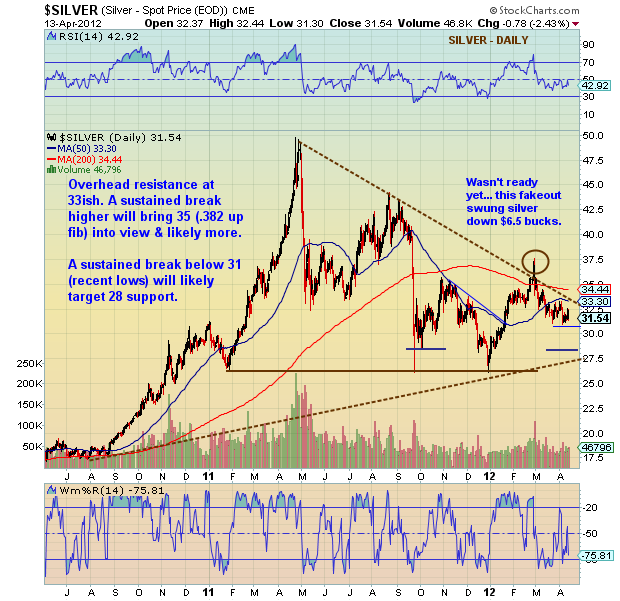
-Ditto for Silver, sidewinding its way to a 31.54 weekly close. Some may call it coiling under its downtrend line, some may say it pausing after a sizey “fakeout” and sell off. Still too early to tell. Let the price prove itself before making big bets.
-Seasonal and technical timing targeting a bounce by end of April/early May.
-Spain and European debt starting to make headlines and talk of QE3 picking up after lackluster US jobs report. If either show their face, or if the “long term” US debt picture heats up during the presidential election campaign, the metals should rise.
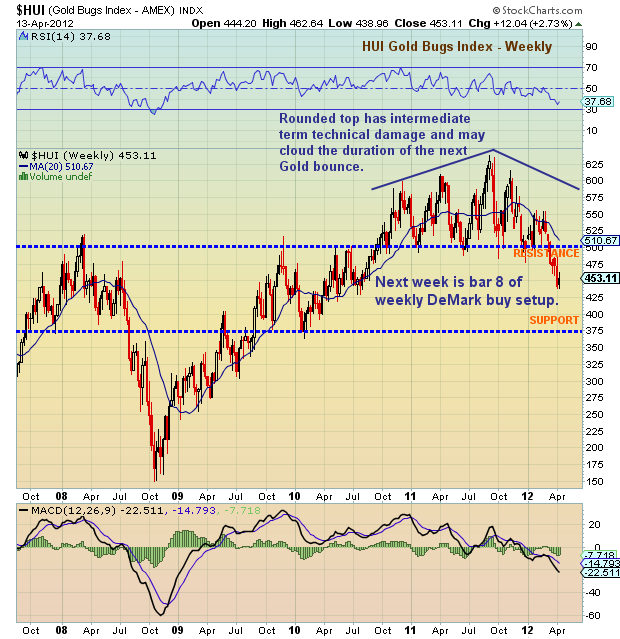
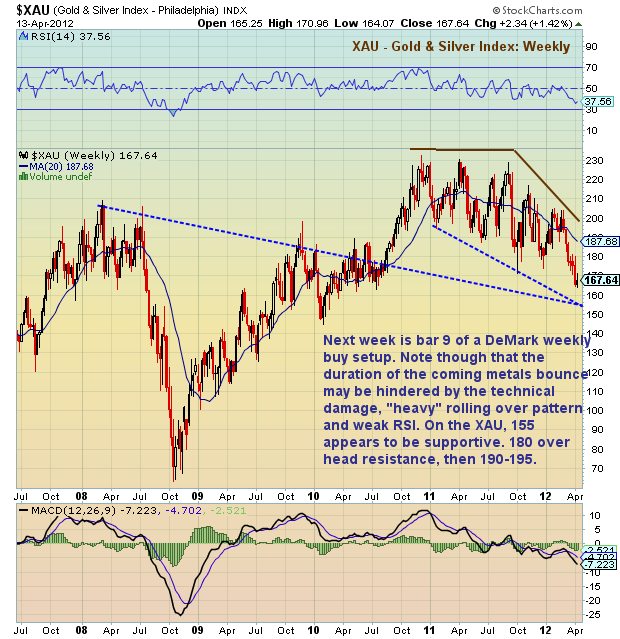
-Magnitude of bounce is likely to be dampened by last year’s rounded top and technically “heavy” Gold Bugs Index (HUI) and Gold and Silver Index (XAU). In fact, recent “heaviness” combined with DeMark weekly setup counts have the metals on alert for a couple more weeks.
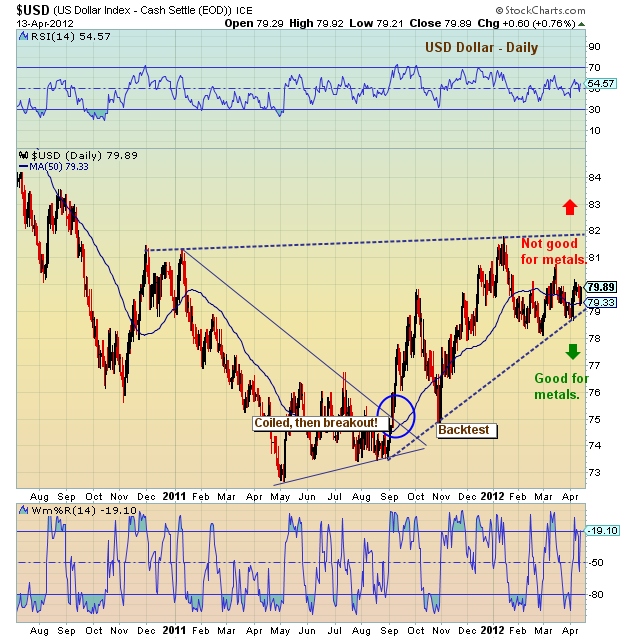
-Watch the Dollar over coming days/weeks. It’s currently resting near lower uptrend support. Inverse correlation (higher dollar bad for metals, lower dollar good for metals).
Trade Safe and good luck in the week ahead.
GOLD Charts
GOLD BUGS Index
GOLD and SILVER Index
SILVER charts
DOLLAR Update
———————————————————
Twitter: @andrewnyquist and @seeitmarket Facebook: See It Market
No positions in any of the securities mentioned at the time of publication.
Any opinions expressed herein are solely those of the author, and do not in any way represent the views or opinions of his employer or any other person or entity.
Your comments and emails are welcome. Readers can contact me directly at andrew@seeitmarket.com.

