 By Andrew Nyquist
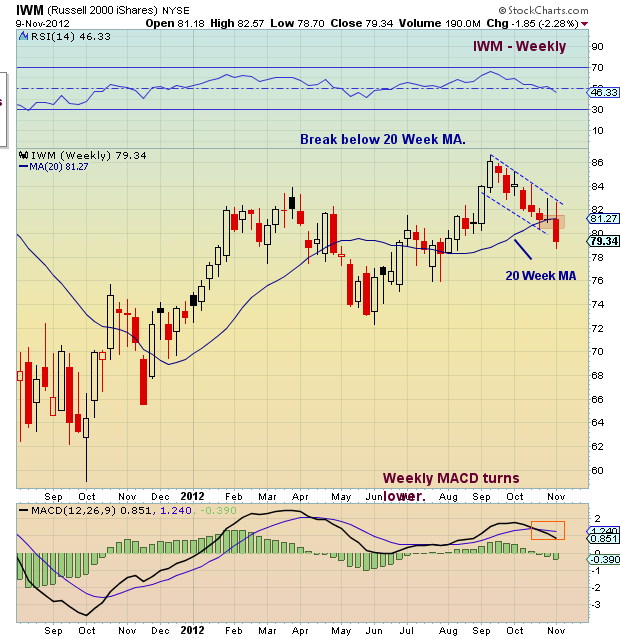
Quick technical update. Last week, the Small Caps and Russell 2000 (IWM) broke down through key supports and incurred technical damage. That said, they are oversold and could rally back to the scene of the crime (trend line break and 20 week moving average). See charts below.
Trade safe, trade disciplined.
More charts found here.
Russell 2000 iShares (IWM) stock charts as of November 9, 2012. Russell 2000 charts with important support and resistance levels and broken trend lines. IWM technical analysis for November. Small Caps break down.
———————————————————
Twitter: @andrewnyquist and @seeitmarket Facebook: See It Market
No position in any of the securities mentioned at the time of publication.
Any opinions expressed herein are solely those of the author, and do not in any way represent the views or opinions of his employer or any other person or entity.


