The stock market is still trading near all-time highs. However, it’s been trading with high price volatility for several weeks.
War abroad, geopolitical and domestic politics, and of course the Federal Reserve and interest rates… taken together, this is causing the markets to gyrate.
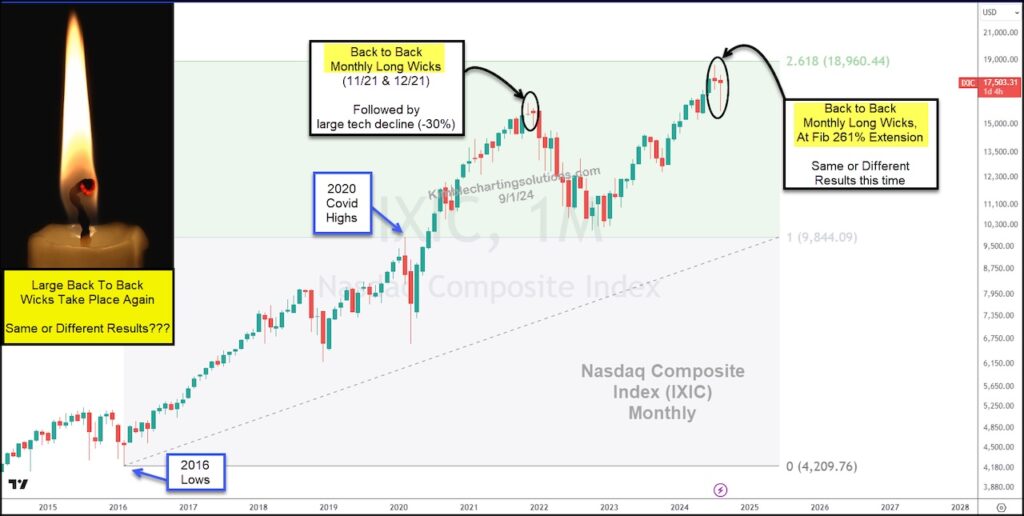
Today we look at a long term “monthly” chart of the Nasdaq Composite to highlight some recent concerns.
Using applied Fibonacci to the 2016 low and 2020 high, we can see that the Nasdaq touched up near its 2.618 Fibonacci extension in July.
This resistance appears to be important… especially when we consider the past two monthly price wicks! Both are very long and indicate confusion.
And if history is an example, we recently saw this back-to-back pattern in November/December 2021 which marked a top (and a -30% decline to follow).
In my humble opinion, this is an interesting pattern to follow heading into September. Careful here and stay tuned!
Nasdaq Composite “monthly” Chart
Note that KimbleCharting is offering a 2 week Free trial to See It Market readers. Just send me an email to services@kimblechartingsolutions.com for details to get set up.
Twitter: @KimbleCharting
The author may have a position in mentioned securities. Any opinions expressed herein are solely those of the author, and do not in any way represent the views or opinions of any other person or entity.

 Fails Key Support Level; What’s Next?")
 Weakness Remains; Sell Rallies?")
 Is A Favorite AI Stock: What About Timing?")


