In the wake of Fed Chairwoman Janet Yellen’s allusions during her Senate testimony today to a “reach for yield” and “isolated pockets” of valuations stretched “beyond historical norms” in Biotech and other industries, the small cap benchmark Russell 2000 is significantly under-performing it’s broad US equity index peers – as it has throughout most of 2014.
The reasons for this persistent small cap under-performance are many, including their susceptibility to the fickle behavior of momentum flows as risk appetite waxes and wants; along with their more concentrated geographic exposure (as Andy Nyquist noted over the weekend here) to the US. Whatever the ultimate reasons, though, price is clear on the net result: Small Cap stocks are out of favor in 2014, an emergent trend that may be signaling the end of their secular leadership and potentially holds adverse implications for longer-term equity market returns.
In times of noisy market dynamics, low volatility and minimal net change such as this, it is never more critical to zoom out to long-term charts for context to ensure your perspective – no matter what time frame you trade – remains informed as you assess risk and reward.
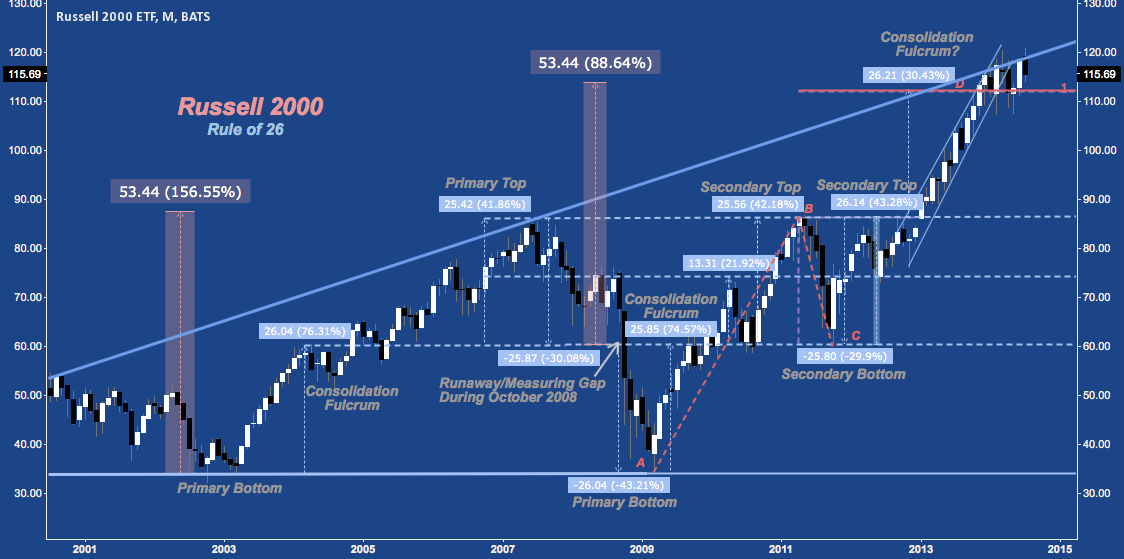
As it turns out, the monthly chart of the iShares Russell 2000 ETF (IWM) has much to contribute. One of my favorite studies is the Rule of 26, analytical short-hand for observing that IWM has advanced, entered extended consolidation at and reversed at intervals of approximately 26 points. Since December 2013, IWM has been in a congestion zone between secular rising trend line resistance (thick blue line) above and it’s latest 26 point interval near 112 (also the 100% of the ABCD pattern off 2009’s bottom).
The defining long-term question for the Russell 2000 is: is this a consolidation only; a secondary top, or a primary top?
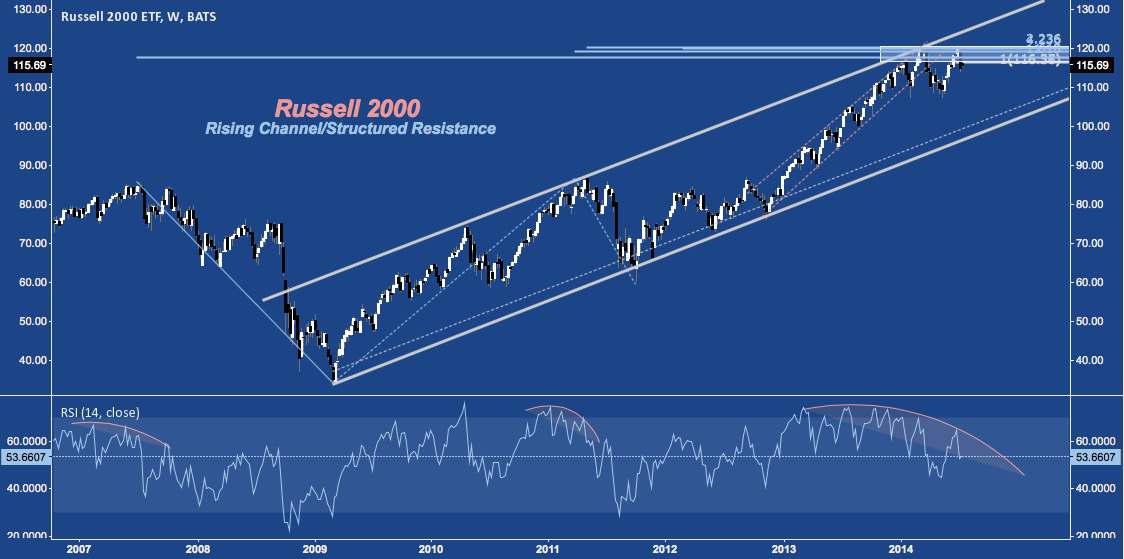
Zooming into a weekly chart of IWM, the structure of the Russell’s advance off March 2009’s low suggests at least a secondary top. R2k tagged a major confluence of rising channel and structured Fibonacci cluster resistance at it’s all-time high in mid-March. So far, the renewed push higher of mid-May’s 107.44 bottom has stalled, entering a lower high back at cluster resistance. On balance, so far this is merely a hesitation in IWM’s primary cyclical up-trend; but sideways action and faltering momentum (see RSI’s negative divergence in lower panel) underway since Q4 2014 are too evocative of 2007 and 2011 not to take notice:
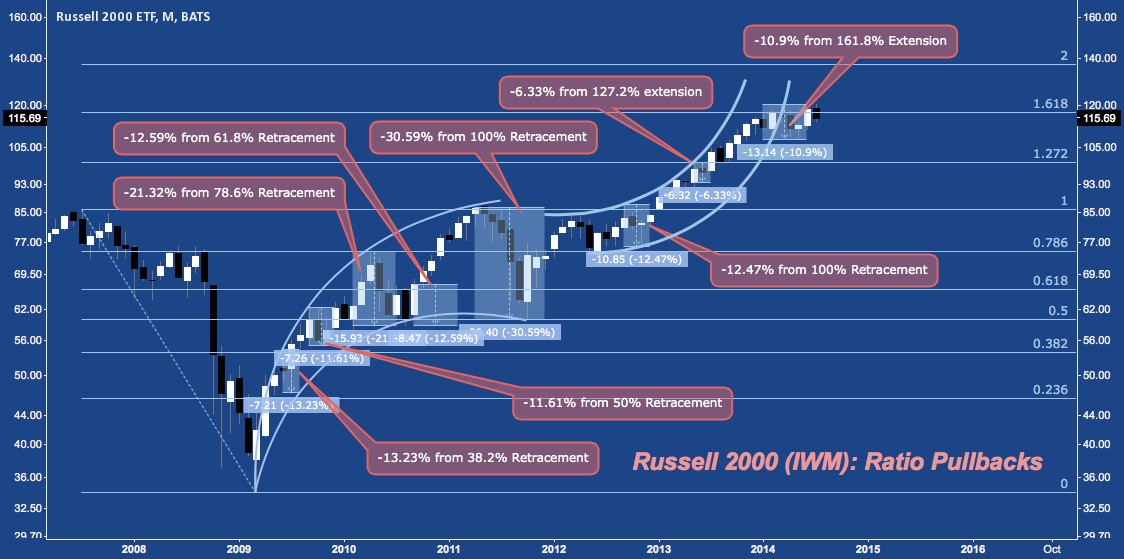
Parsing the 2009-2014 bull a different way, we see that 2014’s congestion has broken IWM’s rising arc, swapping out the steep moonshot trajectory that was renewed after Spring 2012’s corrective low for an aimless move sideways. Of the 8 major pullbacks/corrections since March 2009, April/May 2014’s was second only to Summer 2013’s as smallest, though it’s size is roughly consistent with five of the other seven at -11.5% to -13.5%.
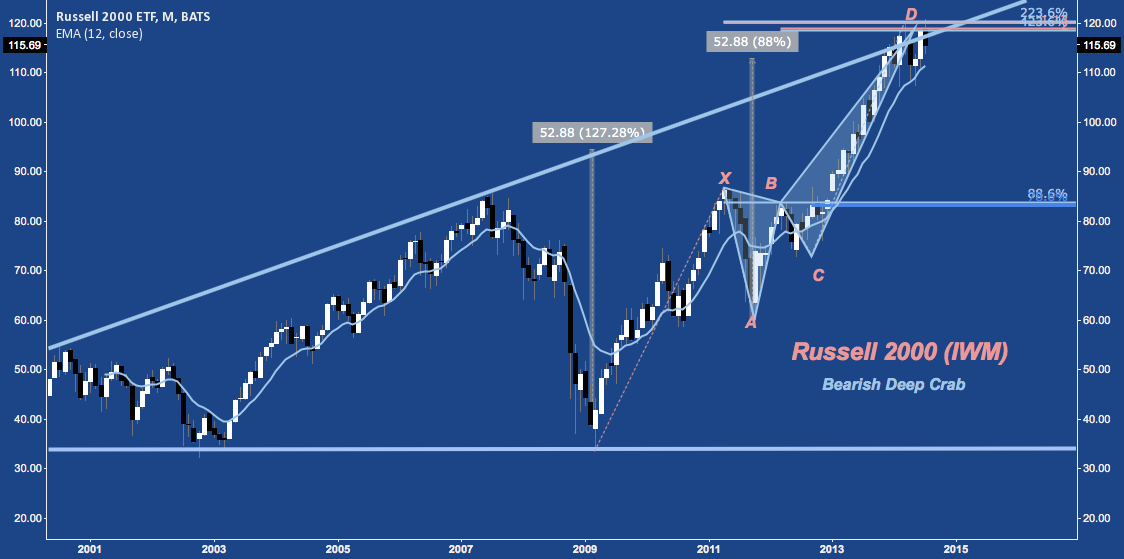
An elaboration of the Rule of 26 in the next chart shows the cyclical importance of 112: this remains the level bulls want to get away from and bears want to revert below. The 52 point leg off the Q3 2011 bottom built out a Bearish Deep Crab harmonic pattern that pegs its potential reversal zone (PRZ) just above this level near 120 and secular rising trend line resistance:
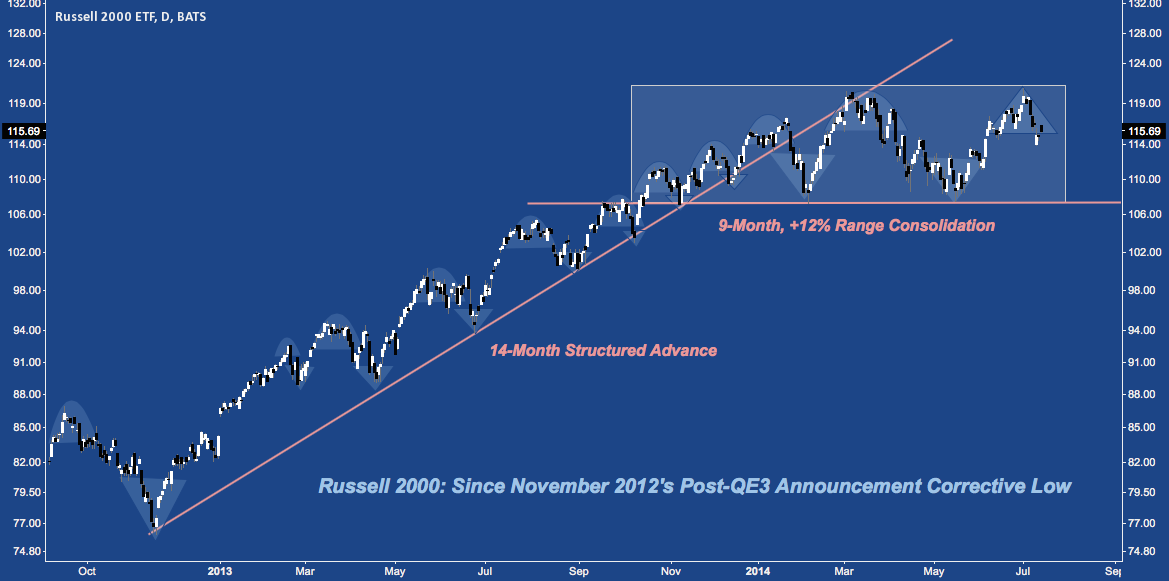
These patterns and technical market suggest the resolution of 2014’s YTD consolidation are immense for the cyclical bull. Paring back IWM’s Daily chart, the current passage of hesitation is clear with November 2012-December 2013’s series of uniform higher lows and higher highs giving way to a broad stalemate:
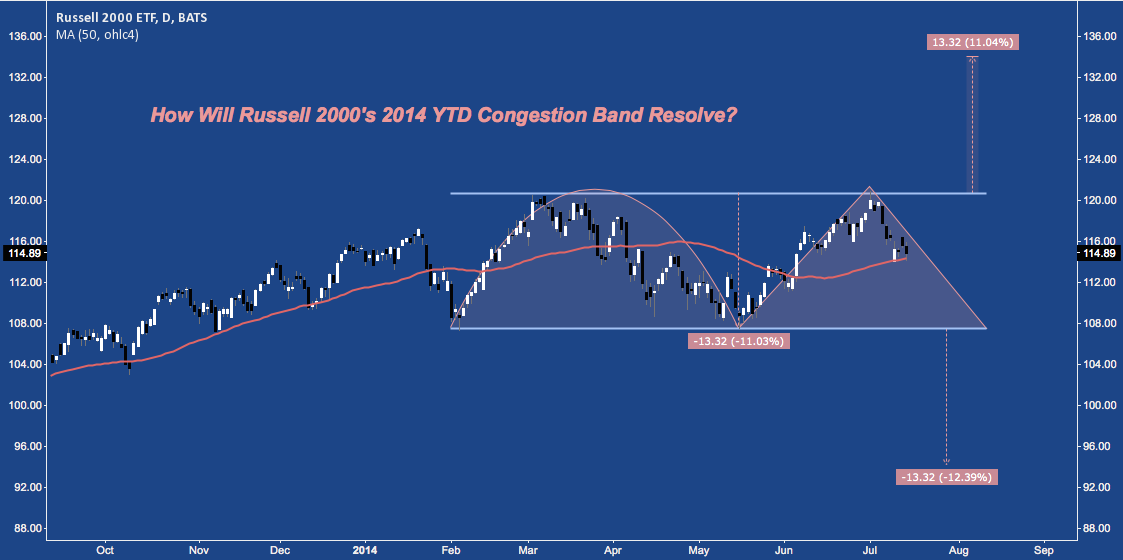
For the Russell – all-but unchanged after 6 months following a massive +30% year – 2014 comes down one question: is the current sideways market 1) a yet-to-be triggered Eve/Adam Double Top (a scenario supported in part by a complacent CBOE Equity Put/Call Ratio), or 2) a range consolidation that merely represents an index digesting the previous year’s outsized gains (as denoted by the flattened but supportive 50-Day SMA) before resuming it’s climb higher?
The next 10%+ will be decided by the answer.
Twitter: @andrewunknown and @seeitmarket
Author carries net short exposure to the Russell 2000 at the time of publication. Commentary provided is for educational purposes only and in no way constitutes trading or investment advice.

