Tag: technical analysis
S&P 500 Index Reaches Above Monthly SD Bollinger Band
The S&P 500 "monthly" chart shows the extent of how far this year's 25 percent rally has come.
And what it may mean for stocks...
The Current State of Global Equities In 4 Charts
U.S. Markets
Not much has changed in a week. Upside momentum remains firm and we have a number of stock market indices above their 40-week...
S&P 500 Trading Update: Another Backtest… or Breakout?
Whoa, the stock market is on fire this week. Just 3 days into the last week of the month, and the S&P 500 (NYSEARCA:...
S&P 500 Update: October Correction or Bear Market For Stocks?
Still at cabin, hunting quite difficult with 75 degree temps and humid. Rained all day today.
A cold front is coming in tomorrow so I...
S&P 500 Technical Update: Bulls Eye 2800 Level
Stock Market Technical Comment
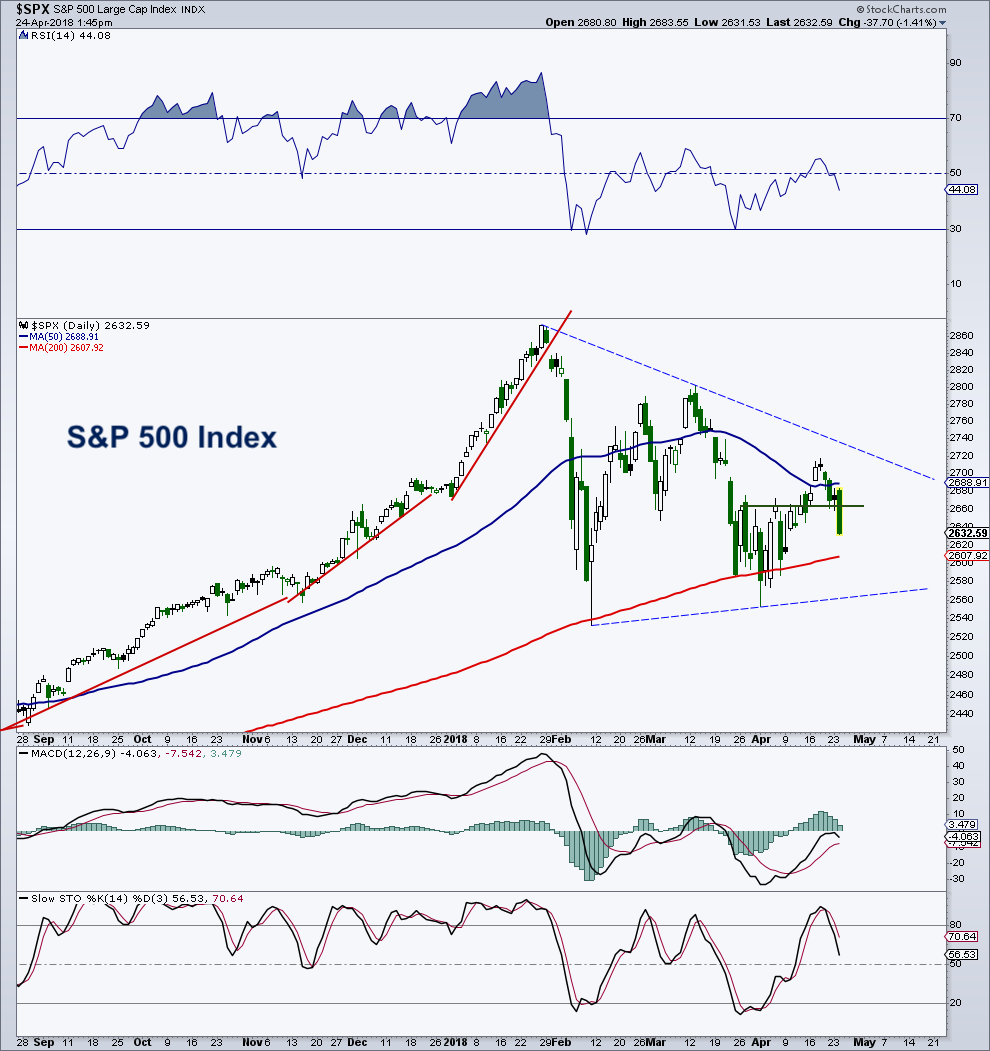
The stock market, as defined by the S&P 500 (NYSEARCA:SPY), remains in a large volatile, choppy mess.
HOWEVER, the latest decline into...
U.S. Equities Technical Update: More Frustration For Investors
Been a rough week for the S&P 500 and like broad market indices.
And Tuesday's price action offered an exclamation point delivered on behalf of...
The Continuing Saga of a Range-Bound Stock Market
I’m often asked whether I’m bullish or bearish on a certain market.
I always like to remind people that the market can go in three...
Here’s Why The Stock Market Is A Sloppy Mess
The bulls got caught looking higher this week...
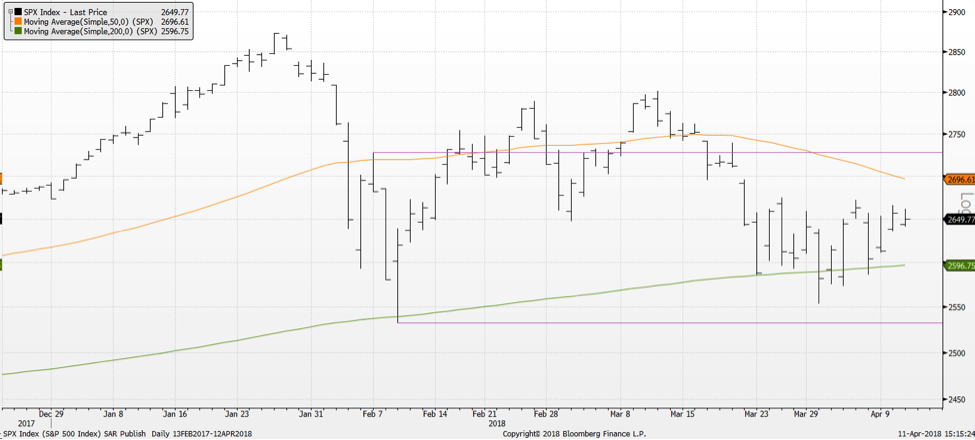
While many investors have had high hopes about a successful retest of the February stock market lows,...
S&P 500 Correction Chart: Another Pitchfork In The Road
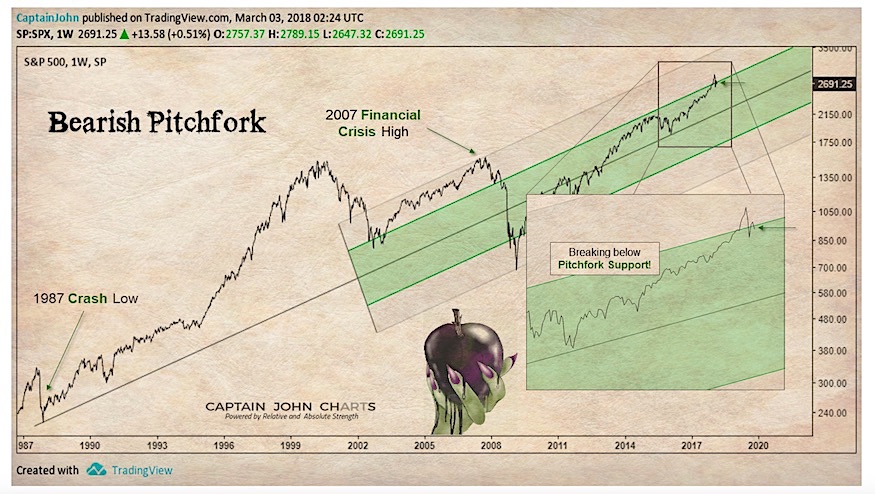
Last week, I shared a chart that started an Andrew's pitchfork off the 1987 lows. The purpose of that post was to highlight potential...
S&P 500 Intermediate-Term Downside Risk Levels
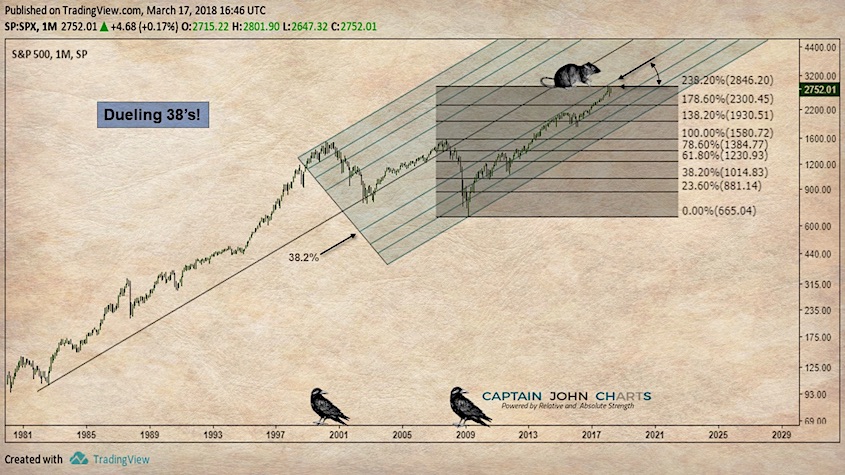
We are going to look at the S&P 500 today using monthly and weekly charts.
First is a look at S&P 500 using Fibonacci analysis;...


