Tag: chart analysis
Recent Treasury Bond Meltdown Getting Overdone
When we last wrote about treasury bonds for See It Market in September, we suggested that treasury bonds were on the verge of turning...
S&P 500 Futures Trading Outlook For December 13
Stock Market Outlook for December 13, 2016 –
S&P 500 Futures are still below its high of 2264.75 but appears to be setting up for...
S&P 500 Futures Trading Outlook For December 12
Stock Market Outlook for December 12, 2016 –
As the rate hike probability holds above 94%, traders are assuming that markets can handle the event...
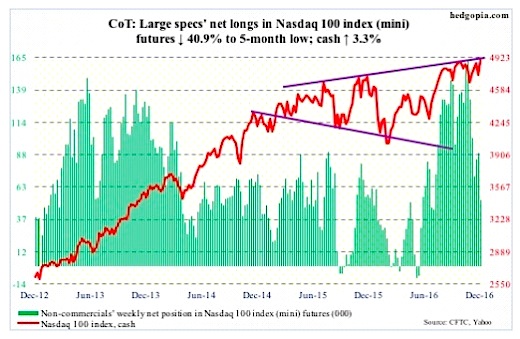
December 9 Commitment Of Traders: Equities Over-Heating?
The following is a recap of the December 9 Commitment Of Traders Report (COT) released by the CFTC (Commodity Futures Trading Commission) looking at COT...
S&P 500 Futures Trading Outlook For December 8
Stock Market Futures Outlook for December 8, 2016 –
Thoughts about range bound activity quickly dissipated yesterday as all the major indices surged over resistance...
Global Market Trends: 5 Charts Investors Need To Watch
Today I want to share 5 macro technical charts that bear importance here for the broader markets. In my chart review, I sift through individual...
S&P 500 Futures Trading Outlook For December 7
Stock Market Outlook for December 7, 2016 –
Though the S&P 500 (INDEXSP:.INX) is creeping higher, it is doing so under lighter volume. As I said...
S&P 500 Futures Trading Outlook For December 6
Stock Market Outlook for December 6, 2016 – Can Buying Pressure Hold?
The battle continues in a contested region here for S&P 500 futures this morning....
Natural Gas Technical Analysis & Weather Outlook For December
Natural Gas Technical Analysis
Prompt-month Natural Gas held the $2.52 support level in mid-November then rocketed to fresh 2-year highs above $3.50 last week. The...
S&P 500 Futures Trading Outlook For December 5
Stock Market Outlook for December 5, 2016 –
A battle is brewing between buyers and sellers on the S&P 500 (INDEXSP:.INX) this morning. But buyers...


