Tag: chart analysis
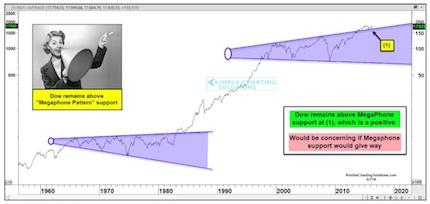
Dow Jones Megaphone Pattern Defines Risk On / Off
Below is a chart of the Dow Jones Industrial Average going back to the 1950’s using monthly closing prices. It highlights two important Dow Jones Megaphone...
S&P 500 Futures Outlook: Trading Levels For June 9
S&P 500 futures outlook for June 9 – Another high sold off overnight, but charts have held higher supports as expected. The damp momentum...
Is The RBOB Rally Running Out Of Gas?
From Memorial Day on, the financial media tends to talk about the "summer driving season" and how an increase in automobile use should benefit gas...
S&P 500 Futures Update: Can Bulls Keep The Momentum?
S&P 500 futures outlook for June 8, 2016 – ES_F –Breakout formations grinding higher this morning after a day of consolidation at these breakout...
June 7 S&P 500 Futures Trading Outlook: Bulls Look Higher
June 7 S&P 500 futures outlook – Breakout formations continue to hold, and momentum is now holding steady. Overall, patterns still look bullish, with the...
S&P 500 Futures Outlook: Trading Levels For June 6
Stock Market Futures Outlook for June 6, 2016 – S&P 500 futures (ES_F) –Breakout formations continue to hold, as momentum continues to drift down....
Weekly Stock Market Outlook: Sentiment & Breadth Gain
June 3rd Stock Market Outlook and Technical Review
Here’s a look at some key stock market indicators and emerging themes that we are watching:
Beneath Surface,...
Japanese Yen Wave Pattern Points To Coming Decline
If the U.S. Dollar continues to rally, as we showed in the forecast we posted in May , then it should set up favorable...
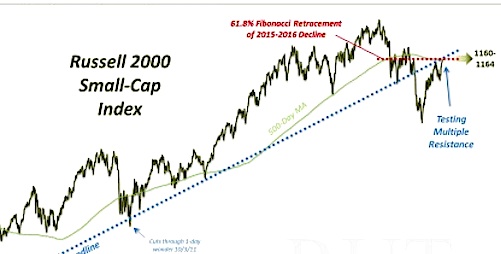
Can The Russell 2000 Index Rally Past Major Resistance?
The Russell 2000 Small-Cap Index is presently running into a confluence of key resistance points. Can the Russell 2000 Index rally past this level?
We’ve...
S&P 500 Trading Update: Will Lower Support Levels Hold?
Today's trading outlook looks at S&P 500 futures, Nasdaq futures, and Crude Oil futures for June 3, 2016.
Focusing on S&P 500 futures, we see...


