Tag: chart analysis
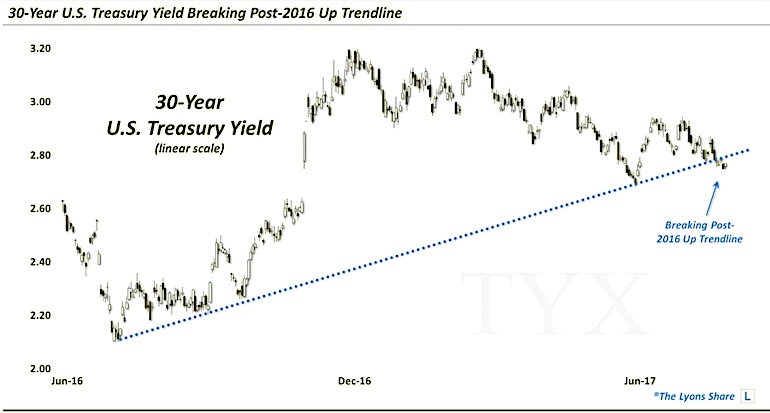
Chart Spotlight: U.S. Treasury Yields Under Pressure
As many of you know, I like to share charts that on trend lines. Whether price is testing, retesting, breaking out, or breaking down...
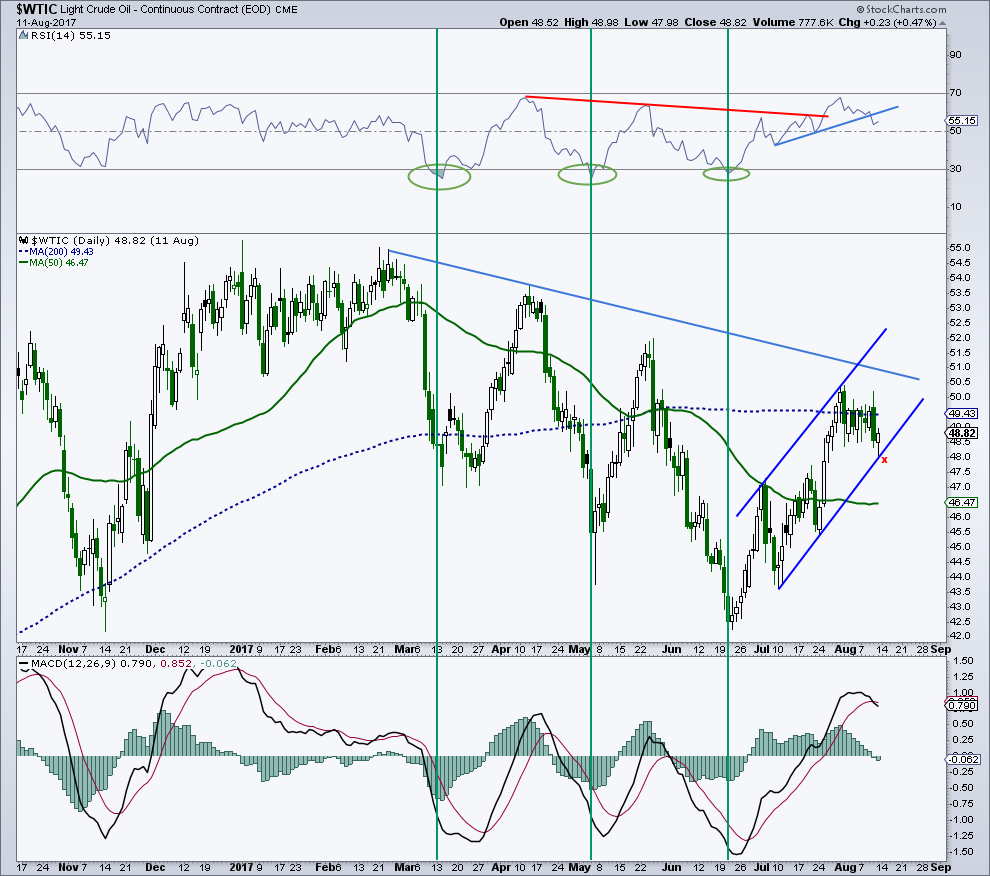
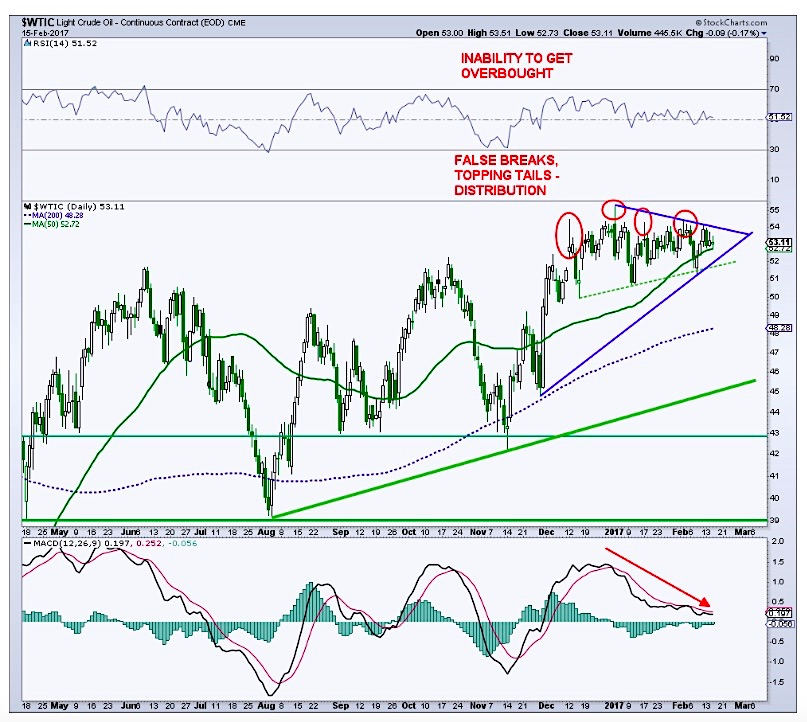
WTI Crude Oil Trading Outlook Turns Bearish
After poking its head above the $50 level for the first time since May, West Texas Crude Oil (WTI) is backing off a bit.
Is...
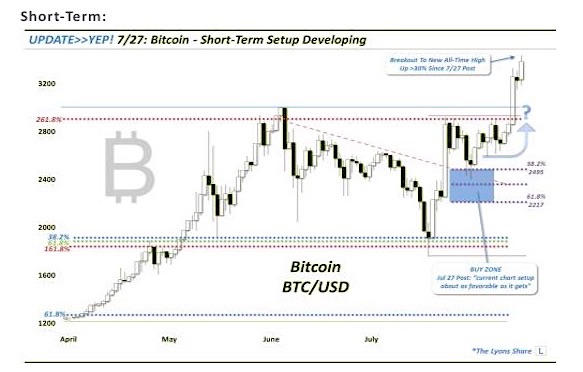
Cryptocurrency Craze: 3 Reasons Bitcoin Is Rallying
This post was written a couple weeks ago for my premium service. I think it has some interesting trading insights so I'm sharing here...
Crude Oil Likely To Rally Before Heading Lower Once More
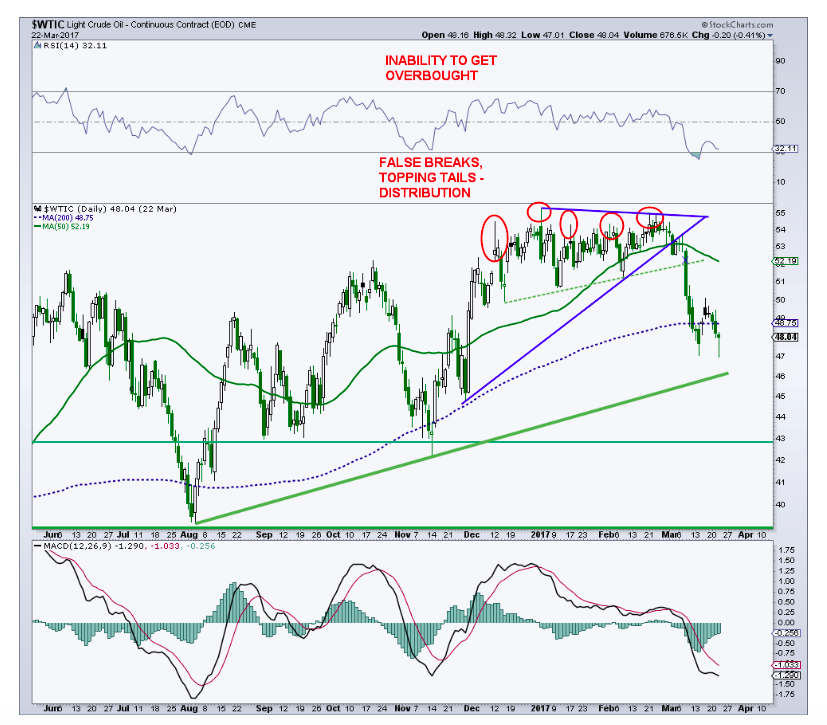
Where Is Crude Oil Headed?
West Texas Crude Oil (WTI) is currently sitting near $47.85/barrel, and continues to waffle around its 200-day average near $48.75....
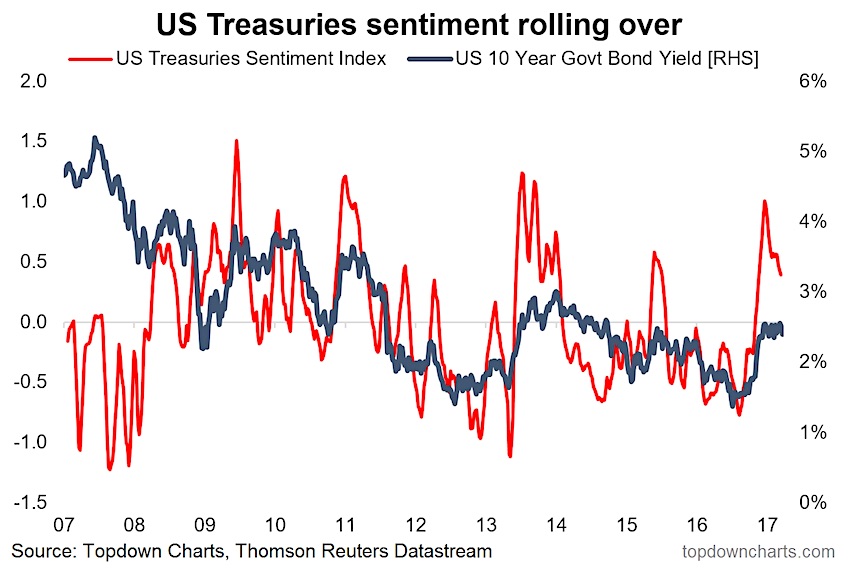
Bond Market Sentiment Slides On Outlook Concerns
This article looks at a unique market indicator that we've put together on the bond market. It provides a nice gauge of expectations for...
Crude Oil Technical Update: Market Bulls Face Hurdles
There's been very little change in the outlook for crude oil over the past week.
Fundamental and technical hurdles remain but from a price perspective, traders...
Stock Market Futures Trading Outlook For February 10
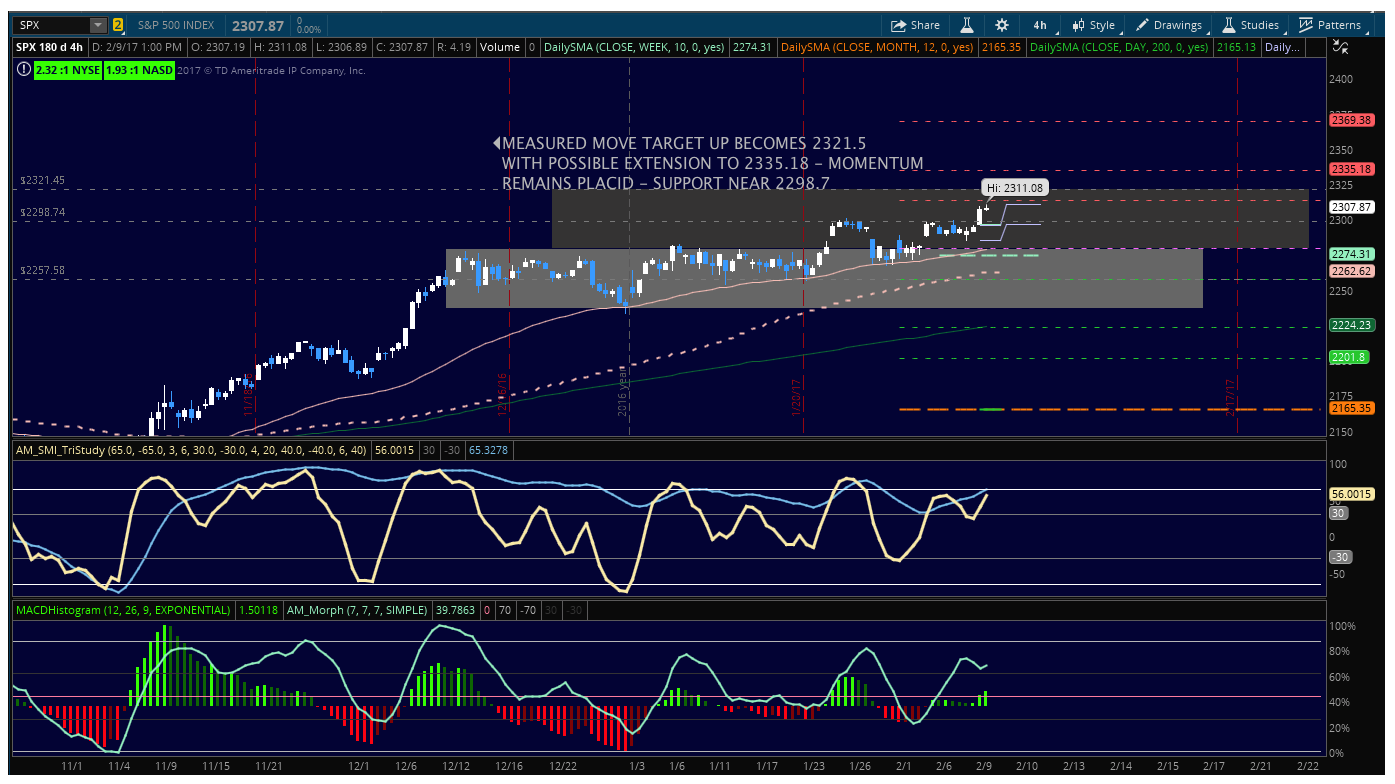
S&P 500 Futures Considerations For February 10, 2017
Tax reform news kept markets higher yesterday, and overnight gains in Europe and Asia are allowing for...
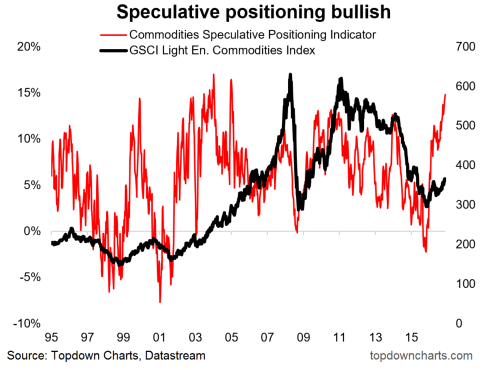
Commodities Speculative Positioning At 10 Year High
The below chart shows average speculative futures positioning (standardized against open interest*) across 15 different commodities - giving effectively an asset class view for...
German Bunds, US Treasuries: Yields Approaching Support
The bonds complex may be setting up for a near-term reversal of sorts. The charts below show the potential for a near-term low in...
Is Crude Oil Breaking Down? Here’s What I’m Watching
Crude oil has gone nowhere over the past 10 weeks.
We’ve been discussing the potential for a breakout trade in our market recap videos for the past several weeks as...

