Tag: chart analysis
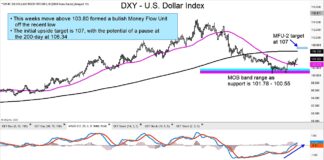
Update: US Dollar Index Strengthens, Bond Yields Heading Higher
Since the start of the new year we have shared a couple updates on the US Dollar and 10-Year US Treasury Bond Yield... both...
Natural Gas ETF (UNG) Testing Top Of 7-Year Falling Price Channel
Over the past several weeks, I have dedicated a hefty sum of my time to looking at the rise in commodities (as it ties...
Long Term US Treasury Bonds (TLT) Turn Bearish In August
Long dated US treasury bonds have been rising as economic data continues to be soft.
When bond prices rise, it means yields (interest rates) are...
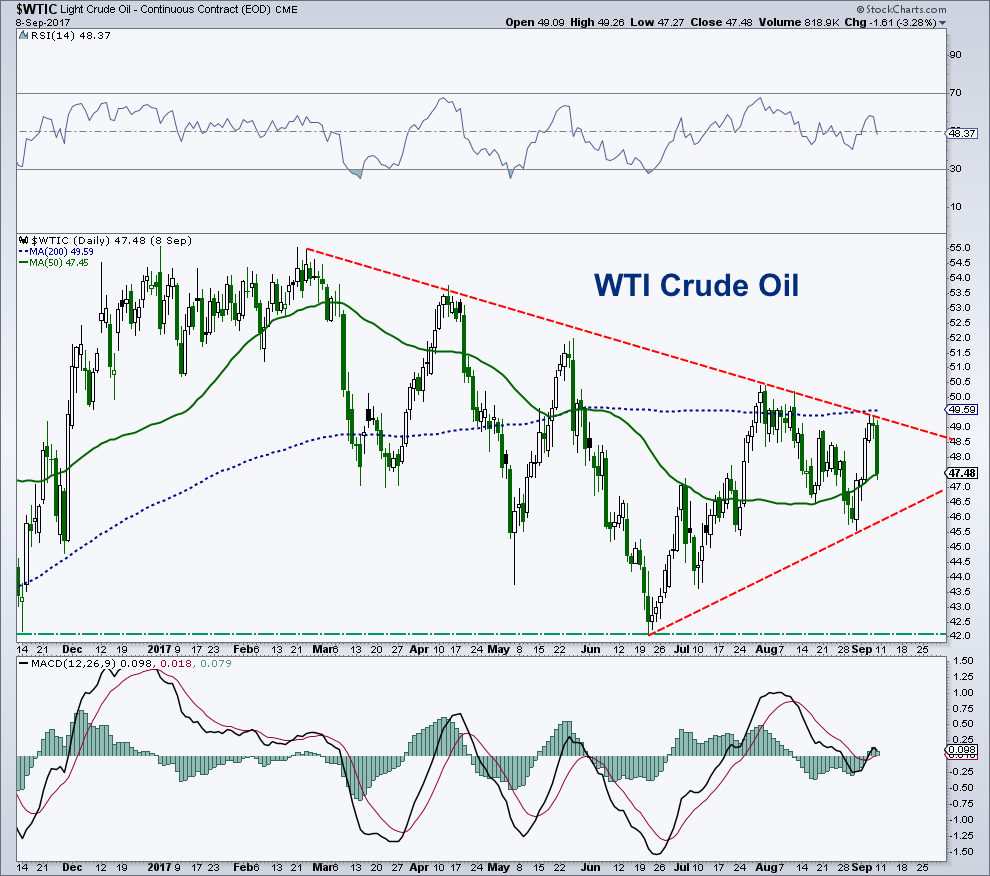
Crude Oil Chart Spotlight: Will Near-Term Price Support Hold?
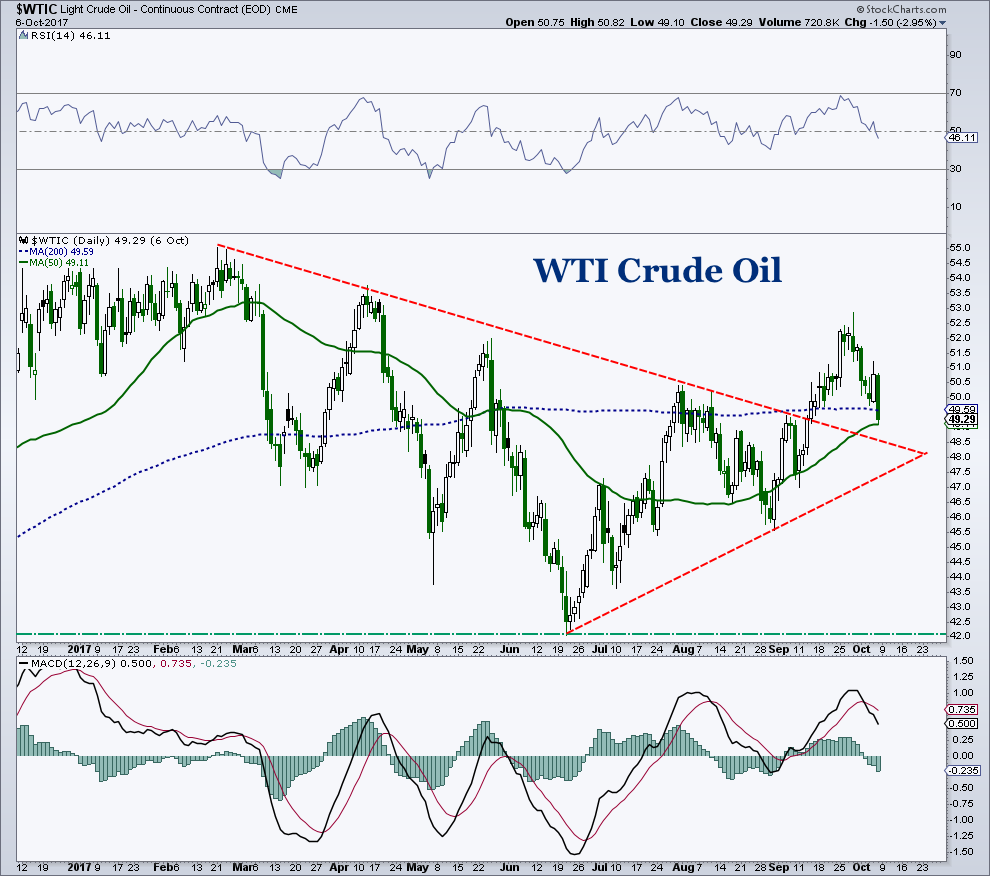
Crude Oil Chart – Daily
West Texas Crude Oil (WTI) is currently sitting under $50 per barrel.
After bouncing off its 200-day average and chart support...
Gold Chart Spotlight: Bulls On The Ropes…
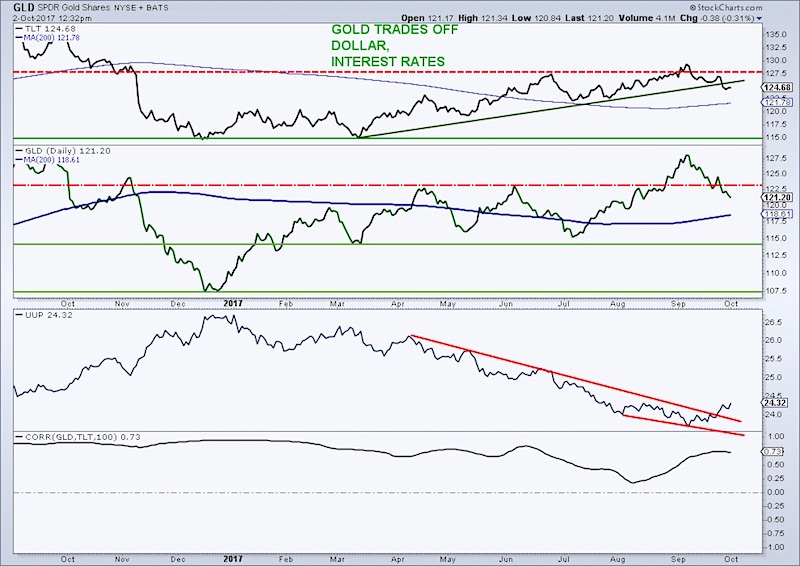
iShares Gold Trust (NYSEARCA:GLD) Analysis & Outlook:
Our steadfast bearishness toward the yellow metal, even as the world turned bullish, is paying off.
Gold prices (GLD)...
Gold / U.S. Dollar Ratio Racing To A Near-Term Peak?
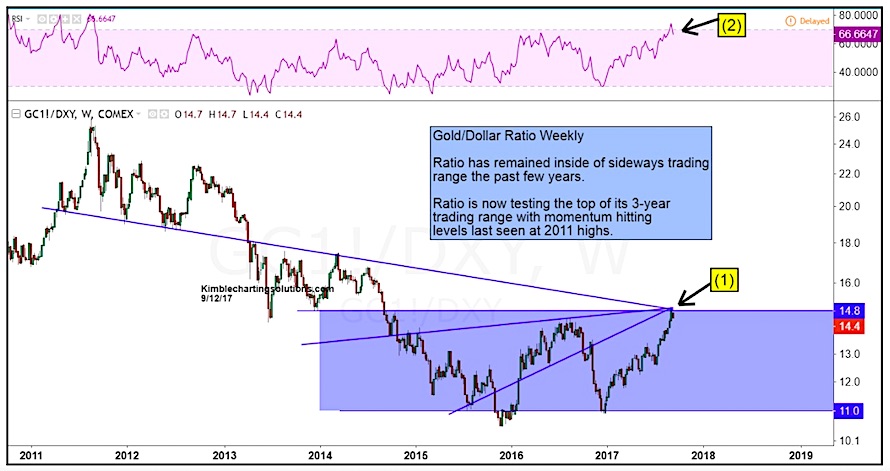
Two of 2017's major investing themes thus far are the return of Gold (NYSEARCA:GLD) and the prolonged weakness in the U.S. Dollar (CURRENCY:USD).
Year-to-date, Gold...
Crude Oil Price Outlook: Risk/Reward Favors Bears
West Texas Crude Oil (WTI) bounced up near $49/$50 last week after holding chart support in the $46 region. But that price area represents...
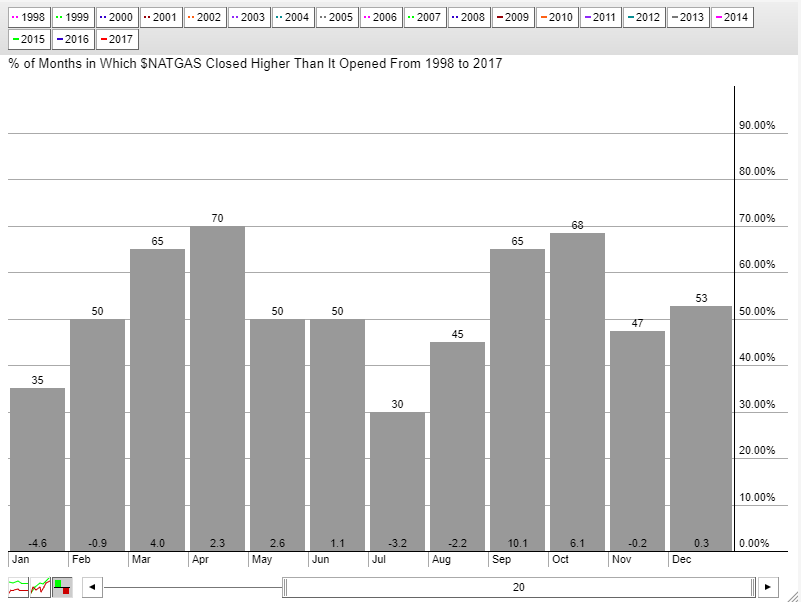
Natural Gas Prices Coil As Bullish Seasonality Approaches
Natural Gas (NG) continues to trade in a range-bound manner in 2017. The prompt-month contract peaked on the final trading day of the year...
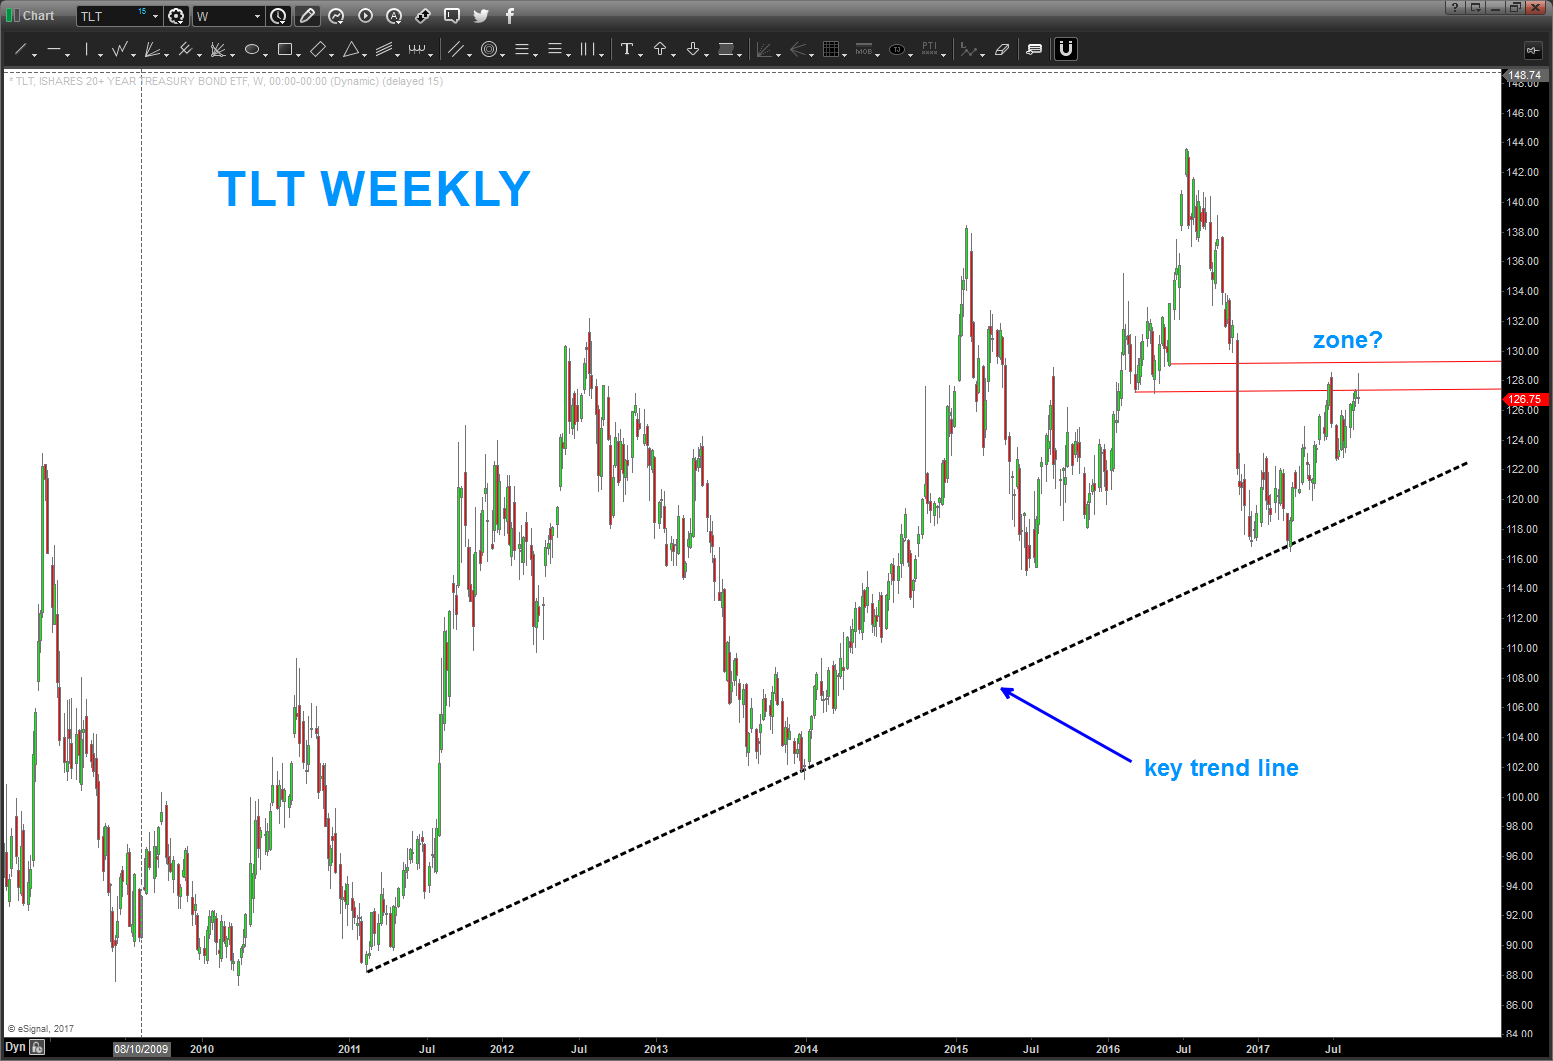
Treasury Bonds Rally Nears Key Price Resistance Area
In my last update on the 20+ Year Treasury Bond ETF (NASDAQ:TLT) and broader bond market, I highlighted the case for a deeply oversold...
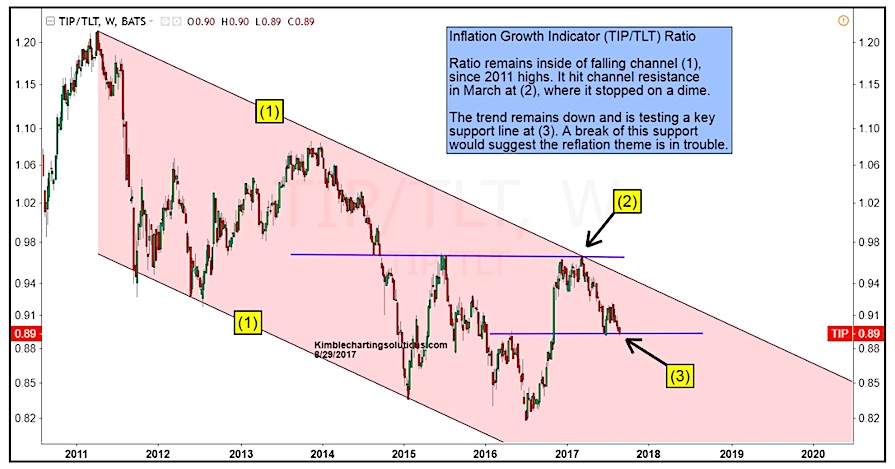
Key Inflation Gauge Testing Merits Of Reflation Theme
Back in June, we took a look at a key inflation gauge and pointed out why the reflation theme wasn't quite ready for primetime just...

