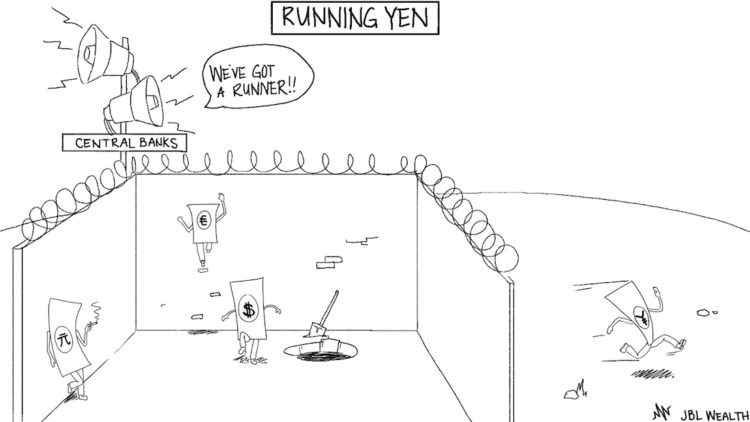
The Japanese Yen continued its rally with another surge higher last week. Quite frankly, this should be on investors’ radars.
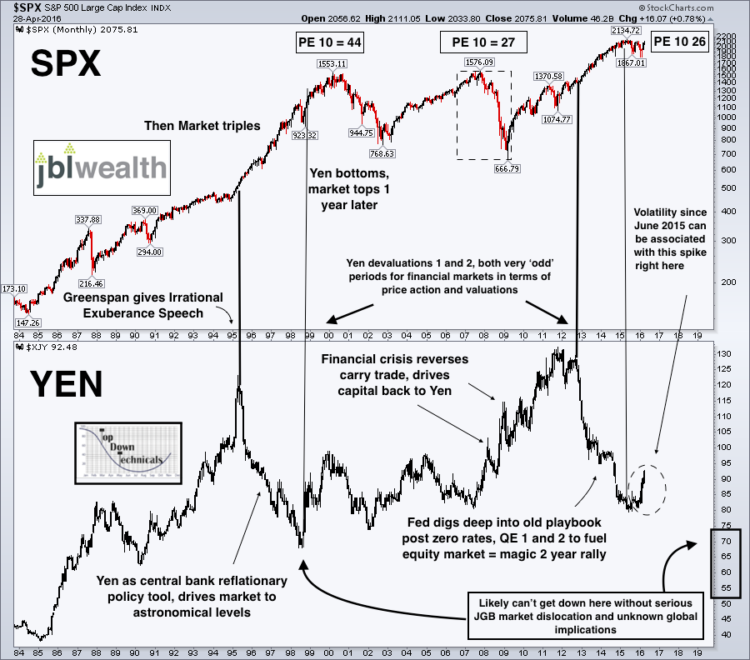
Below is a chart of the Japanese Yen vs the S&P 500 Index. The chart was put together with my colleague and research partner Arun Chopra. Here we have used bullet points to highlight some of the important takeaways in the chart.
- Yen devaluations have been associated with bullish equity markets (carry trade) and valuation extremes in the S&P 500.
- Yen bottoms have been associated with “risk off” markets (carry trade reversals).
- In late 1998 the Yen bottomed, began ripping higher and the S&P 500 peaked 1 year later at extreme valuation.
The S&P 500 is at extreme valuation and the Japanese Yen bottomed in Summer 2015 and ripped higher…different this time?
The Yen ran last week on lack of action by the Bank of Japan. Given the potential consequences for equity markets, someone may want to catch it?

Thanks for reading and best of luck out there.
Further Reading: Are Fang Stocks Signaling Trouble For Market?
Twitter: @JBL73
The authors do not have a position in mentioned securities at the time of publication. Any opinions expressed herein are solely those of the author, and do not in any way represent the views or opinions of any other person or entity.


