Mother Nature can be such a B@*^H!
On March 6, 2024 I wrote a market update on sugar and inflation.
The biggest takeaway is:
We will know about inflation by watching:
- Silver-and if it can begin to outperform gold-CHECK
- Oil, if spikes over $80 a barrel-CHECK
- Sugar, if even with increased production begins to move up back over 23 cents a pound-NOT YET
- The dollar fails 103 and selling pressure returns. Rumor has it through Russia that BRICS is working to create an independent payment system based on digital currencies and blockchain NO
Focusing on sugar
Recent weather conditions like:
- Below-normal rainfall in Brazil -dry weather will reduce sugarcane yields and curb Brazil’s sugar output
- India’s agricultural agency reported a fungus crop (red rot) was spreading through a key sugar-growing region.
- India’s below-normal monsoon rain may curb sugar output-current monsoon season down -11% from the long-term average.
Then add some concerning geopolitics:
- Protectionism is rising as countries look to protect their domestic markets.
- Developing nations, already grappling with food shortages and inflation, are particularly affected. Import-dependent countries, such as many in sub-Saharan Africa, remain vulnerable. For instance, Nigeria, which buys 98% of its raw sugar from other countries, faces challenges due to rising prices.
- Bolivia has been grappling with economic turmoil, which could directly and indirectly impact sugar prices-Bolivia’s economic woes may indirectly contribute to global sugar price fluctuations, especially if it disrupts trade or production.
- Same is true for Kenya, currently in turmoil
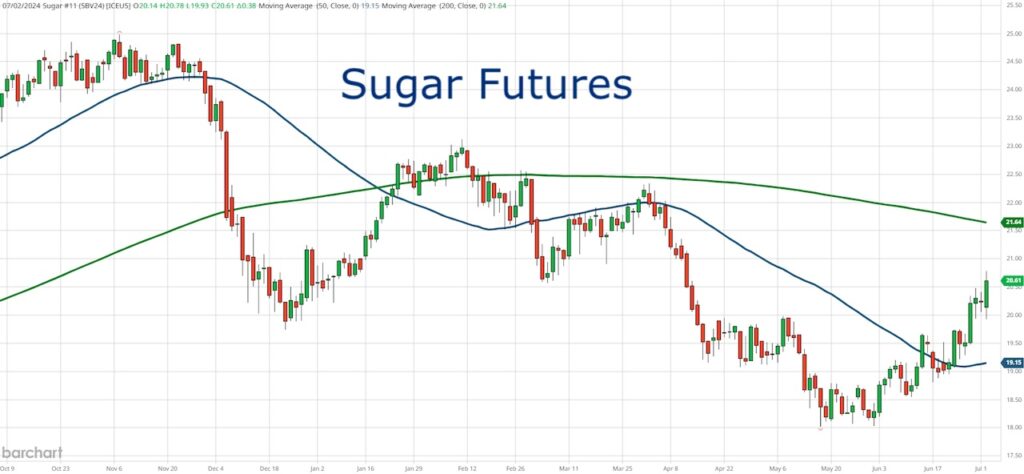
The futures chart shows the clear support at the 50-DMA after it consolidated and formed a base over 20.00.
Next hurdle is 22.00.
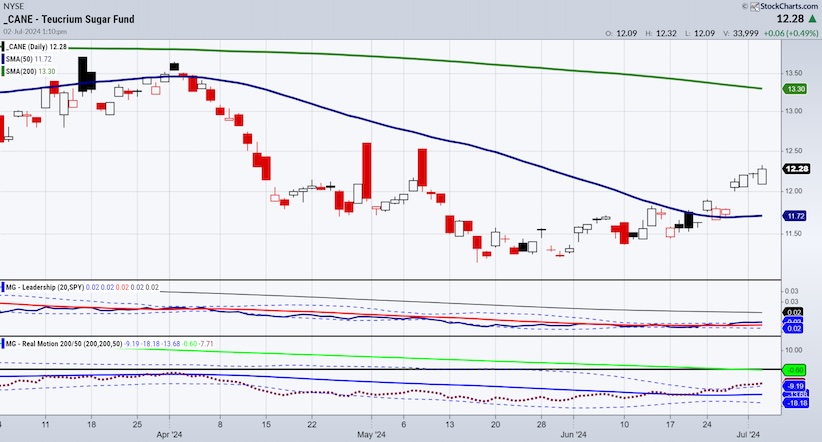
The CANE chart also shows a decent bounce once the 50-DMA cleared and the price of 12.00 (risk point).
CANE is outperforming the benchmark for the first time in a while.
Real Motion shows us momentum inclining with the clearance of the Bollinger Band.
Resistance is higher at 13.30 or the 200-DMA.
While we keep hearing about disinflation, I keep seeing signs of nuanced inflation.
Whether sugar is our ultimate X factor or not, it is super reliable to watch because it checks all the boxes
- Weather
- Geopolitics
- Social unrest
- Supply chain and labor
I will be taking the rest of the week off.
The next Daily will be published July 8 with an Outlook available this coming Sunday.
Twitter: @marketminute
The author may have a position in mentioned securities at the time of publication. Any opinions expressed herein are solely those of the author and do not represent the views or opinions of any other person or entity.

 Fails Key Support Level; What’s Next?")
 Weakness Remains; Sell Rallies?")
 Is A Favorite AI Stock: What About Timing?")


