On November 7, 2024, I wrote a Daily called Food Commodities Comeback-1st Sugar, Now Soybeans.
Back then I wrote,
It should come as no surprise that I have been watching sugar futures carefully for years.
As the 3rd in my trifecta of inflation indicators, sugar has been sitting in wait.
However, the chart looks incredible, but we will get to that in a moment.
My bigger point is, the food shortages from weather, geopolitics, tariff wars, lower rates, higher demand, and so on tell me that 2025 we could see a huge spike back up in all food prices.
The USDA forecasts that 2024/25 global sugar ending stocks will fall to a 13-year low of 38.339 MMT.
So far in 2025, that statement is holding up well.
Coffee and gold (not food, but still impressive) made new all-time highs.
Corn has shot up; soybeans are now catching up along with wheat.
My inflation trifecta, while has yet to trigger, is for now, worth watching.
The dollar has not fallen that much; however, it does appear to have topped out.
Silver has yet to outperform gold.
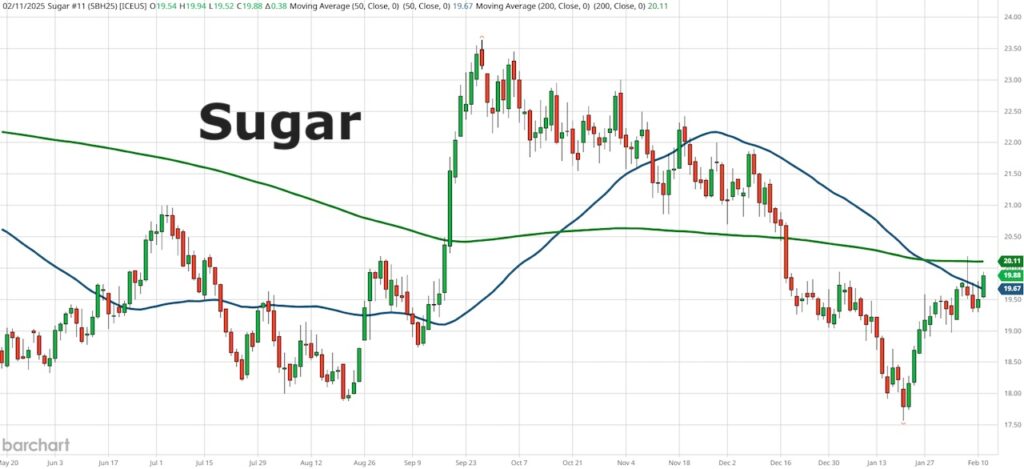
Sugar though, is starting to look close to a major breakout.
The futures chart (March contract) shows us that sugar over 20 cents is worth paying attention to as it clears the 200-day moving average.
From a crop standpoint, Covrig Analytics cut its 2025/26 global sugar surplus estimate to 4.1 MMT from a previous estimate of 5.2 MMT.
Plus, a top sugar trader projected Brazil would crush 1.6% less sugarcane in the 2025/26 season.
India’s 2024/25 sugar production from October 1 to January 31 was also down -12.2% y/y to 16.5 MMT.
One bright spot is that Thailand’s Office of the Cane and Sugar Board projected that Thailand’s 2024/25 sugar production would jump by +18% y/y.
Bottom line, if global supply falls, sugar can easily go parabolic as demand will rise, especially during uncertain times.
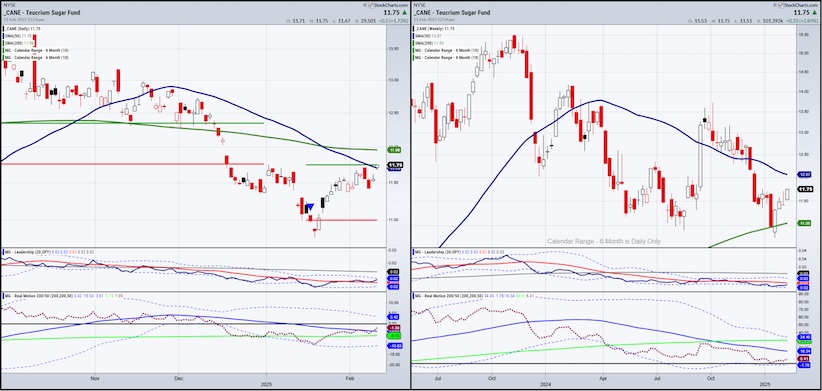
If you do not want to trade futures, you can look at CANE, the ETF for sugar.
The daily chart has several great indicators flashing bullish.
- Phase change that needs to be confirmed
- Calendar range high clearing- (note the podcast Geoff and I did on phases and calendar ranges converging)
- Outperforming the benchmark
- Momentum increasing
The weekly chart shows us that more work is needed over a longer timeframe.
- Not quite close to the 50-week moving average which has a negative slope
- Momentum improving but not screaming higher
- Still underperforming the benchmark.
Of course, this could just as easily be a rally into resistance.
Nonetheless, should current levels clear, the upside potential is great.
Twitter: @marketminute
The author may have a position in mentioned securities at the time of publication. Any opinions expressed herein are solely those of the author and do not represent the views or opinions of any other person or entity.
: Creating Bullish Divergence?")

 and Semiconductors (SMH): Concerning Price Pattern?")
 and Semiconductors (SMH): Concerning Price Pattern?")


