Sugar Futures Prices – Fundamental Analysis
The price of sugar is exposed to many global and national influences.
These include government tariffs, costs of production, climate change and geopolitical instability.
These demand and supply factors all influence movement within the market.
Most sugar production occurs in a few countries across the world. The top producing countries include Brazil, India and Thailand.
A report published in 2018 revealed evidence for the positive interdependence between crude oil and the world food price index, comprising the sub-categories dairy, cereals, vegetable oil and sugar.
In various countries, sugar is considered a strategic commodity. For example, in Russia, the government heavily supports the growth of the sugar industry,
Since sugar is viewed as more of a luxury than a necessity, wealthier economies generally have higher consumption than poor economies.
However, sugar and food hoarding during difficult times in poorer countries, makes sugar a luxury highly desired commodity.
Emerging economies in Asia and South America are the fastest growing consumers of sugar, so continued strength in these economies is positive for prices.
So why are we tracking the price of sugar so carefully?
Over the weekend, we covered the significance of the January 6-month calendar range. That will set this week, auspiciously after lots of earnings, PPI and Fed Speak.
And every instrument will create a range. Including sugar.
Sugar Futures Prices – Technical Analysis
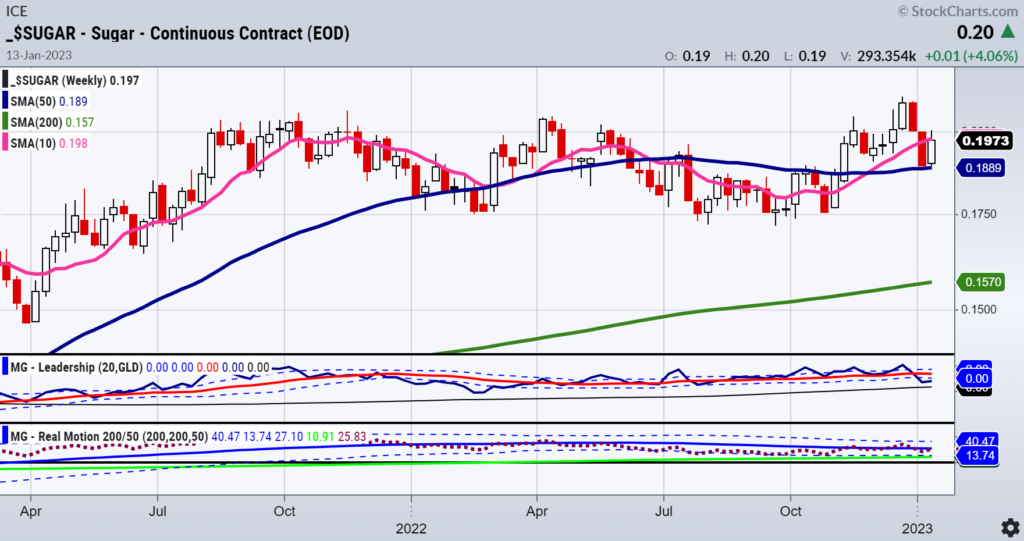
Sugar futures have traded between 17.5 cents and 21 cents for months. While many instruments traded to new mutli-year lows in 2022, sugar has held steadfast.
On the weekly chart, sugar futures are in a bullish phase.
On our Triple Play Leadership indicator, sugar has outperformed the benchmark since the fall of 2022.
And although the leadership has declined and now shows an on-par performance with the benchmark, we are nonetheless anticipating that sugar will remain an outperformer in 2023.
The Real Motion Indicator shows momentum a bit underperforming price as the momentum is slightly under the 50-DMA while price is above it.
However, with Tuesday’s price action and the close above 20 cents (chart had not yet updated at time of writing), we expect should that level hold, momentum will improve.
What is noteworthy is that the U.S. dollar rose in price, and sugar acted independently by gaining as well.
As the 6-month calendar range will reset this week, keep in mind that sugar has a range as well to watch.
Whether it is the weather, oil demand (ethanol) versus supply, social unrest (food hoarding) and/or government subsidies, should sugar clear 20.19 (Tuesday’s high), think bullish and inflationary.
Should this week begin as a one-day wonder and the price breaks below 18.92 cents, then assume we will see another trip to around 17.50 with inflation is less of a concern.
We are banking on the former.
Stock Market ETFs Trading Analysis & Summary:
S&P 500 (SPY) Closed above the 200-DMA, now has to stay above and clear 400
Russell 2000 (IWM) Can this get through 190? A gamechanger if does
Dow (DIA) Dec high 348.22 now looms
Nasdaq (QQQ) Right at the 200-WMA resistance 281
Regional banks (KRE) Still the most concerning sector with 60 pivotal and under 57 lights out. Needs to clear 65 to stay in the game
Semiconductors (SMH) Cleared the 50-WMA or 226 and now if good, needs to stay above
Transportation (IYT) Stopped at the 50-WMA or 231.50
Biotechnology (IBB) 138.74 December high the place to clear with 130 key support
Retail (XRT) Amazing how the Jan 6-month range and these 50-WMAs line up in the Economic Modern Family. 66.70 the number to watch.
Twitter: @marketminute
The author may have a position in mentioned securities at the time of publication. Any opinions expressed herein are solely those of the author and do not represent the views or opinions of any other person or entity.


