After a steep drop in Crude Oil prices, many investors and analysts are playing a game of “how low can Crude Oil go?”. But as many folks are busy speculating on the downside, could it be that a Crude Oil rally is nearing and the next move of any significance is actually higher?
This isn’t to say that THE bottom is in for Crude Oil by any means. But perhaps investors should be open to the idea that a Crude Oil rally could become reality over the coming weeks/months.
Last month, Crude Oil did something that has only happened nine other times in the past 30 years!
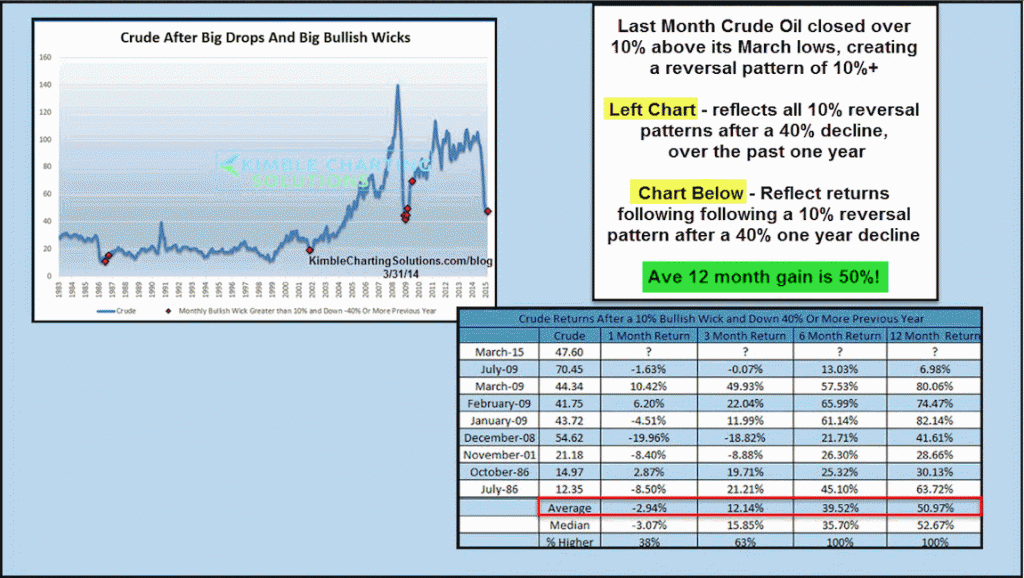
To set the stage for this study and chart below, consider this: Crude Oil closed the month of March over 10% above its intramonth lows, creating a potential reversal pattern. And this occurred after an outsized 12 month decline. Now turn to the chart below. The upper left chart plots points where Crude Oil created at least a 10% reversal pattern following a 40%+ decline over previous 12 months.
As I mentioned above, this combination has only occurred 9 times in the past 30-years!
The table in the lower right provides an overview of returns for Crude Oil when this combination has taken place. As you can see Crude Oil returned an average gain of 12% 3 months out, with returns as high as 50% a year out. The only uncertain period is one month out, which highlights a potential for some near-term volatility
It very well may be different this time as a rising US Dollar and ever-changing global financial landscape pressure commodities. But one cannot help but keep an open mind to the potential for a Crude Oil rally with these type of returns.
Follow Chris on Twitter: @KimbleCharting
Author does not have a position in any mentioned securities at the time of publication. Any opinions expressed herein are solely those of the author, and do not in any way represent the views or opinions of any other person or entity.


