Strong economic cycles often see stocks rise along side interest rates / treasury yields.
A strong economy typically breeds good earnings and higher stock prices.
A strong economy also brings higher interest as the Federal Reserve raises rates to keep inflation at bay (and/or to normalize the rate environment).
However, interest rates can only go so high… before they reach a tipping point.
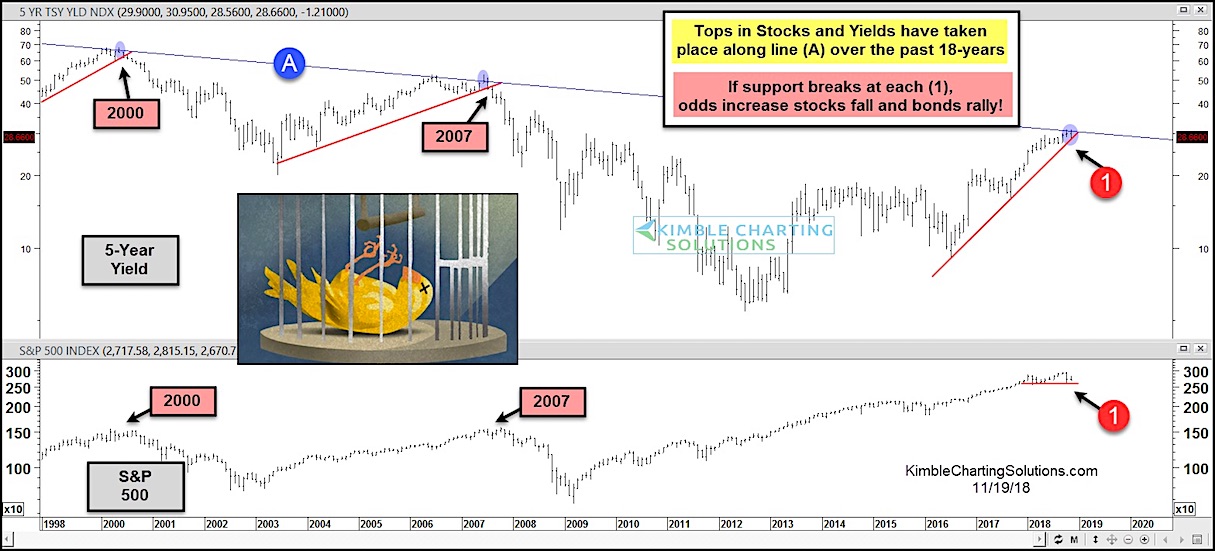
In the chart below, we look at the past 20 years for the S&P 500 and 5-Year US Treasury Yield. They tend to rise together, but when rates/yields roll over and support is breached, a deep stock market decline ensues. See support at (1) on both.
Tops in stocks and yields have taken place along the falling resistance line (A) on the 5-Year. Careful here!
S&P 500 vs 5-Year Yield – Long-Term Chart
Note that KimbleCharting is offering a 2 week Free trial to See It Market readers. Just send me an email to services@kimblechartingsolutions.com for details to get set up.
Twitter: @KimbleCharting
Any opinions expressed herein are solely those of the author, and do not in any way represent the views or opinions of any other person or entity.


