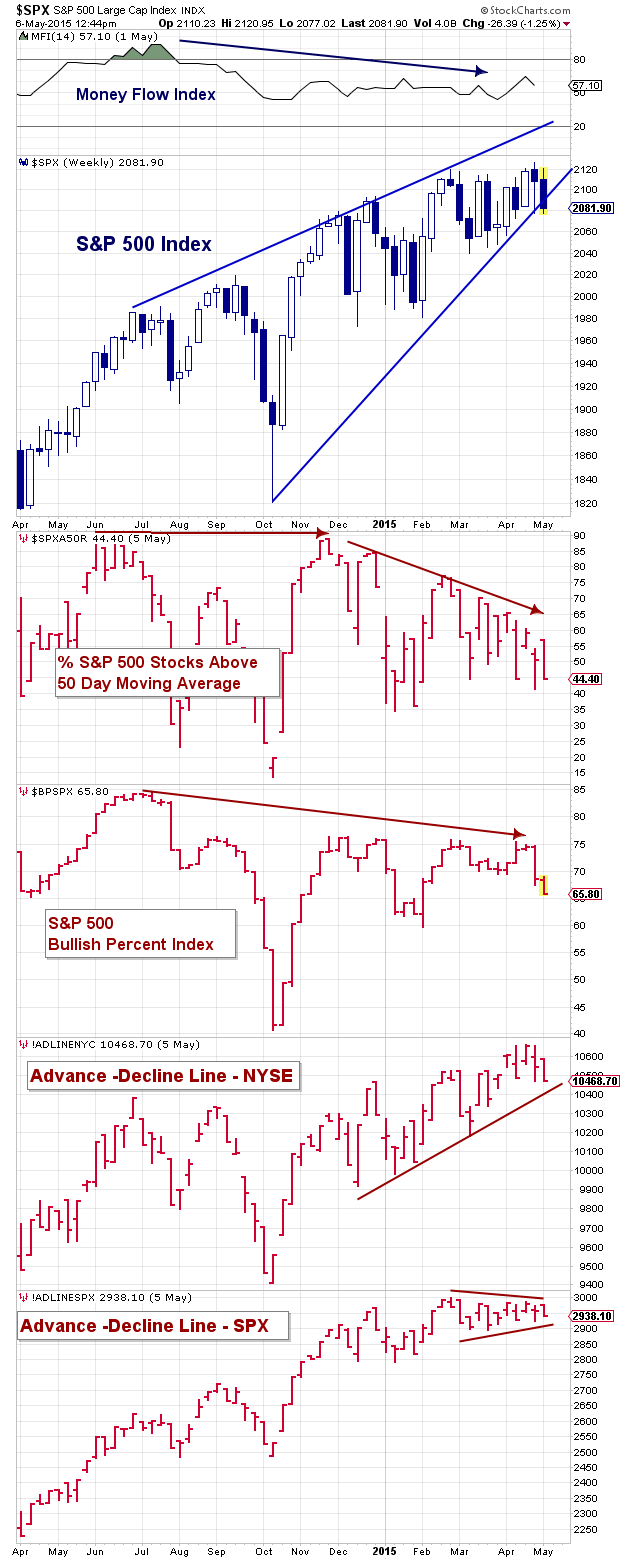
Stocks continue to have trouble gaining traction above 2100 on the S&P 500 (SPX). The broad stock market index has traded in a wide range for most of this year but each time it has touched up near all time highs, it’s been rejected. Now this doesn’t mean that a breakout to new highs can’t or won’t happen. But if we look at this in the context of market breadth, it’s a sign that the market is weakening.
The chart below includes the S&P 500 and several market breadth indicators. As you can see, the market isn’t cooperating (in terms of price and breadth). For several months, indicators like Money Flows, Percent of Stocks Above the 50 Day Moving Average, and the Bullish Percent Index have shown deteriorating market conditions. BUT broader market breadth indicators like the NYSE and S&P 500 Advance-Decline lines have held up pretty well… until now.
Both of these breadth metrics have paused and are at risk of rolling over. So what are the implications? If breadth remains weak, we could see one of two things: 1) And accelerated rollover in stocks (i.e. a selloff) 2) A weak move higher followed by a deeper selloff.
In short, stock market bulls need to see momentum regroup and participation increase.
S&P 500 Market Breadth Indicators
Note that the Money Flow Index is through May 1 (updated weekly), while several indicators are through the market close yesterday.
Also worth watching is the rising wedge pattern on the S&P 500. Drasko Kovrlija had a great post on the current make up of the rising wedge pattern last month.
Any further deterioration in market breadth will likely imply more stock market volatility. In my opinion, these indicators are worth watching closely (in conjunction with price) in the days ahead. Thanks for reading.
Twitter: @andrewnyquist
The author has exposure to both long and short S&P 500 related securities at the time of publication. Any opinions expressed herein are solely those of the author, and do not in any way represent the views or opinions of any other person or entity.


