It was a quiet news day but Mondays don’t need news to go up.
Today’s image represents the percentage of times that Mondays have closed higher then their Friday close since the March bottom.
It’s also worth noting, that not only does Monday give you a bullish edge in the stock market, it’s also the most bullish day of the week for the Russell 2000 (IWM) by this measure.
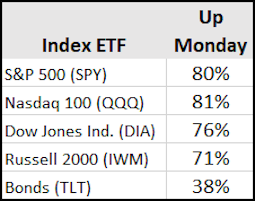
So Monday was a good day to be looking for the consolidation in Nasdaq 100 (QQQ) and the bullish flag patterns in the S&P 500 (SPY) and IWM to break out. All three closed over their Friday highs.
Next, an opening range breakout over today’s high in IWM could kickoff a new leg up in that index.
IWM isn’t the only thing you might want to have your eye on.
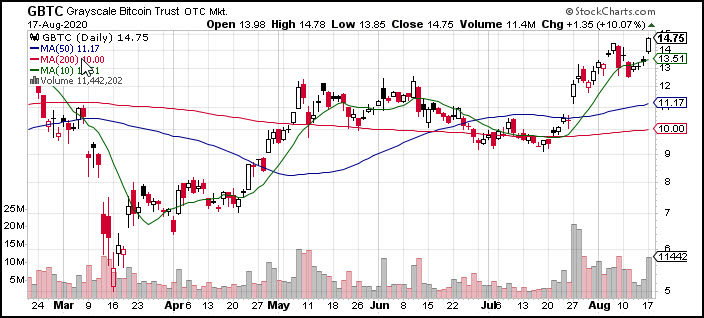
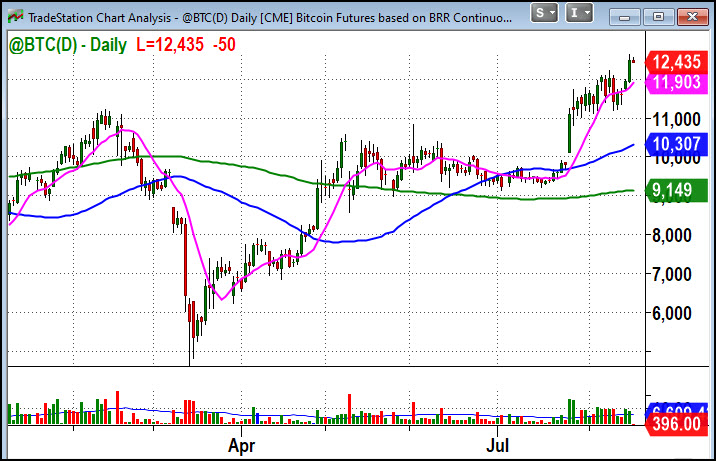
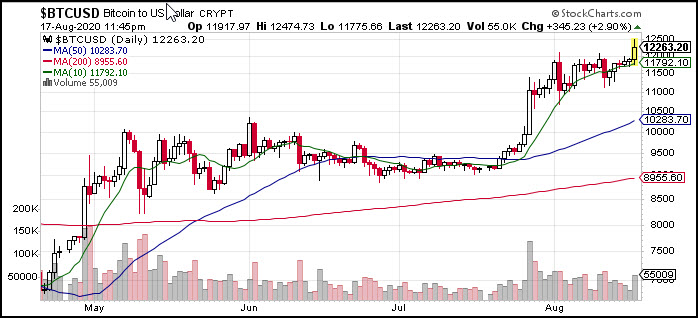
On Friday Bitcoin regained its 10 DMA, and it exploded higher Monday, taking out its recent swing high.
I’m trading Bitcoin with the ETF (GBTC), because that’s the easiest way, but its pattern doesn’t track the futures as closely as I’d like. And the futures don’t track the cash exactly either.
The differences are probably related to the times in which they trade. For example the ETF chart won’t reflect the 24 hour market that the Crypto market trades on. As a result I wanted to see all 3 charts breaking out. Today we got it.
See the charts below.
Key Stock Market ETF Trading Levels for Tuesday:
S&P 500 (SPY) Be cautious under 332. Watch 330 as important support
Russell 2000 (IWM) Key level to break above is 158, the 160 is resistance area and 153 key support.
Dow (DIA) Fourth consolidation day. 270 now pivotal support
Nasdaq (QQQ) New highs. 260 is key support level and a trendline.
TLT (iShares 20+ Year Treasuries) First up day in the last 7 162 next big support.
Twitter: @marketminute
The author may have a position in the mentioned securities at the time of publication. Any opinions expressed herein are solely those of the author, and do not in any way represent the views or opinions of any other person or entity.


