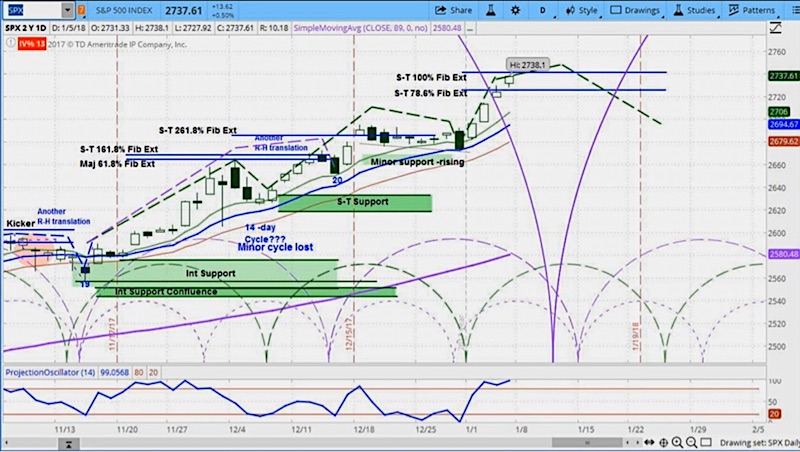
The stock market kicked off 2018 with a bang, as the S&P 500 surged toward 2750.
What will this week bring? Let’s discuss what’s happening now and what our 2018 stock market cycle looks like…
S&P 500 Summary & Market Cycle Outlook:
The S&P 500 moved higher last week, rising by 2.2%. This was driven in part by strong economic data, including manufacturing, construction spending, and job growth.
Our projection for the stock market this week is for choppy price action with the market angling lower overall.
The stock market moved higher last week, with the S&P 500 (SPX) moving up 60 points to 2743, a new record high.
The markets were closed on Monday. On Tuesday, Amazon (AMZN) announced that it shipped over 5 billion items under its Prime membership in 2017. Its stock price was up 1.7% for the day.
On Wednesday, the US Commerce Department announced that construction spending rose 0.8% in November, hitting an all-time high of $1.257 trillion. As well, the Institute of Supply Management (ISM) announced that its Purchasing Manager’s Index rose to 59.7% in December from 58.2% in November.
Also, the Federal Open Markets Committee released the minutes from its most recent meeting. It appears the Fed is still expecting 3 rate hikes in 2018 and is increasingly concerned about a flattening yield curve.
On Thursday, Automatic Data Processing (ADP) released its estimate for private sector job creation of 250,000 in December, which was higher than the 188,000 expected. ADP also revised its estimate for November down by 5,000.
On Friday, the Department of Labor released its estimate which showed that 148,000 jobs were created in December. This was lower that the 190,000 jobs that the market was expecting, and while the market dipped briefly, it later resumed its upside move.
The daily chart above shows our projection for the S&P 500 (SPX) in the coming week: a small choppy down week, with the Fibonacci extension levels, around Friday’s close, providing a reasonable area of resistance. The green-dotted half circles represent the short-term market cycles for Russell 2000 (RUT). The RUT market cycles appear to be driving SPX price more so than the SPX cycles.
For a more detailed look at cycle analysis for a broader selection of futures, watch the askSlim Market Week every Friday afternoon. See our latest video below:
Twitter: @askslim
Any opinions expressed herein are solely those of the author, and do not in any way represent the views or opinions of any other person or entity.


