Yesterday, I shared an important chart of the S&P 500 Index. It was a weekly chart highlighting a key price resistance area. I want to go over some points of interest from that chart, as I believe it will bear importance for both traders and investors alike in the days/weeks ahead.
The S&P 500 Is Nearing A Critical Juncture
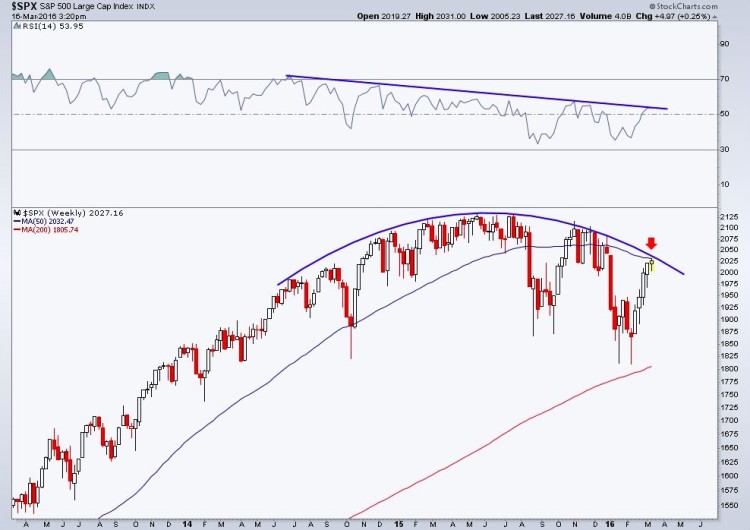
Beginning in late-2014 momentum for the S&P 500 on the weekly chart began making a series of lower highs, a sign that the current stock market trend was likely to be running out of steam. This created the bearish divergence that’s been with U.S. equities for the last year.
In October ’15 stocks experienced the first lower high for price, which began the creation of the rounding top that’s marked on the chart below and could be a level of resistance that stock market bulls have to contend with if price continues higher.
We are also seeing the 50-week Moving Average once again come into play. This indicator has acted as a level of support several times over the last couple of years. Now that price has broken below it, traders will be watching to see if support becomes resistance.
S&P 500 Weekly Chart
Thanks for reading and best of luck out there.
The information contained in this article should not be construed as investment advice, research, or an offer to buy or sell securities. Everything written here is meant for educational and entertainment purposes only. I or my affiliates may hold positions in securities mentioned.
Further Reading From Andrew: “Is The Gold Bear Market Nearing An End?“
Twitter: @AndrewThrasher
Any opinions expressed herein are solely those of the author, and do not in any way represent the views or opinions of any other person or entity.


