This past weekend I was visited by good friend and quantitative market guru Ryan Detrick. We spent a lot of time talking markets and looking at various types of indicators and ratios. Ryan also ran me through a lot of very cool research, covering market sentiment, seasonality, economic interests and general market history. It was a lot of fun.
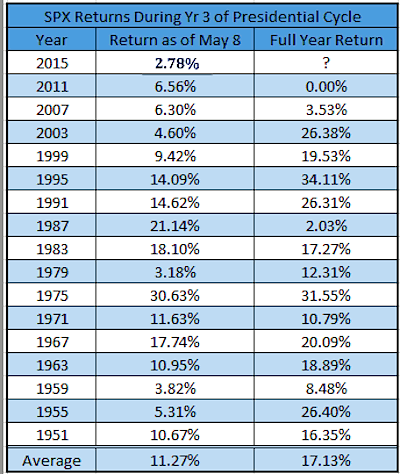
One chart of Ryan’s that I found particularly interesting, was his S&P 500 market performance chart looking at year 3 of the presidential cycle since 1950. That just so happens to include this year. And since 1950, the S&P 500 has performed pretty well in year 3 of a presidential cycle: The average annual return is 17.13%. And the average return through last Friday (May 8th) was 11.27%.
Here’s a data table looking at historical performance of year 3’s of the presidential cycle – courtesy of Ryan Detrick:
As most investors are keenly aware, we’ve drifted sideways for several months and struggled to break out to new highs. Though it is easy to chalk this up to overdue consolidation, it is concerning.
Through last Friday’s close, the S&P 500 was up just 2.78% YTD (note: through today’s close, the S&P 500 is up just 1.92%).
That makes this the worst start for year 3 of a presidential cycle since 1950.
Check out this tweet from us over the weekend – a great looking chart:
This is the worst start to a year since 1950 for year 3 of the presidential cycle. -from our friend @RyanDetrick $SPX pic.twitter.com/eCJ5cQkntS
— See It Market (@seeitmarket) May 9, 2015
The market has been running in place for a while now. Active investors will definitely need to stay disciplined and have a plan if the market begins to stumble. Trade em well.
Twitter: @andrewnyquist
The author has exposure to both long and short S&P 500 related securities at the time of publication. Any opinions expressed herein are solely those of the author, and do not in any way represent the views or opinions of any other person or entity.


