Investor Sentiment
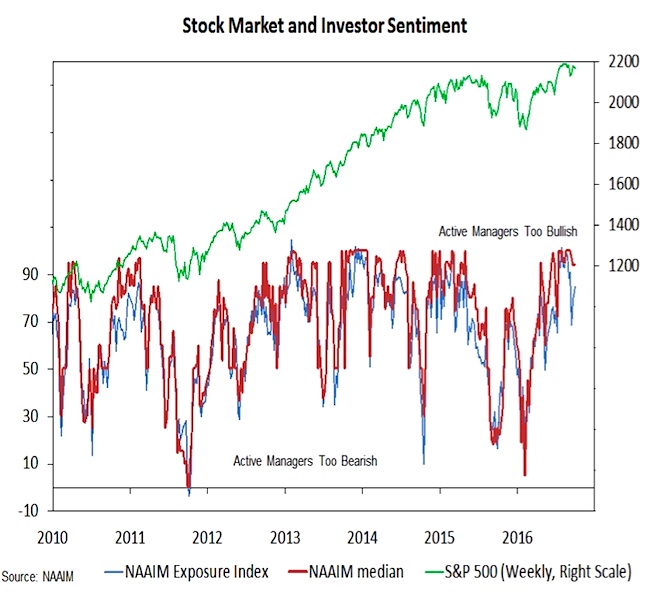
We have seen some evidence that on a near-term basis pessimism has reached excessive levels. The NDR trading sentiment composite moved into the excessive pessimism zone early in September and remains there (albeit, only barely). We have yet to see that level of concern show up in the weekly surveys of investor sentiment/ positioning.
Most notable is the measure of equity exposure by active managers as published by the NAAIM. While the overall index dropped two weeks ago, the median exposure has stayed relative high (above 90% for 12 consecutive weeks). This suggests the drop in the index was due to a few outliers that got rattled early in September. Most managers have remained fully invested (or nearly so).
Dow Transports
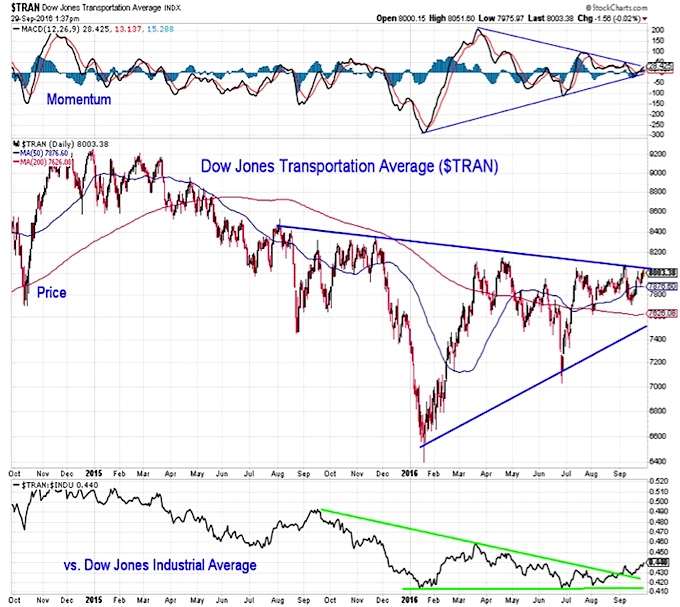
The relative leadership from small-caps and from emerging markets has gotten a lot of attention this year. We are starting to see another leadership trend emerge. Transports are gain strength relative to Industrials. The lack of a new high from the Transports in 2016 has been a concern, but over the last couple months, they have rallied on a relative basis. Transports have broken out of the relative price down-trend and are testing resistance from both a price and momentum basis. If this pattern holds, Transports could be well-positioned to lead any year-end rally that comes once election-related jitters have subsided.
S&P Utilities Sector
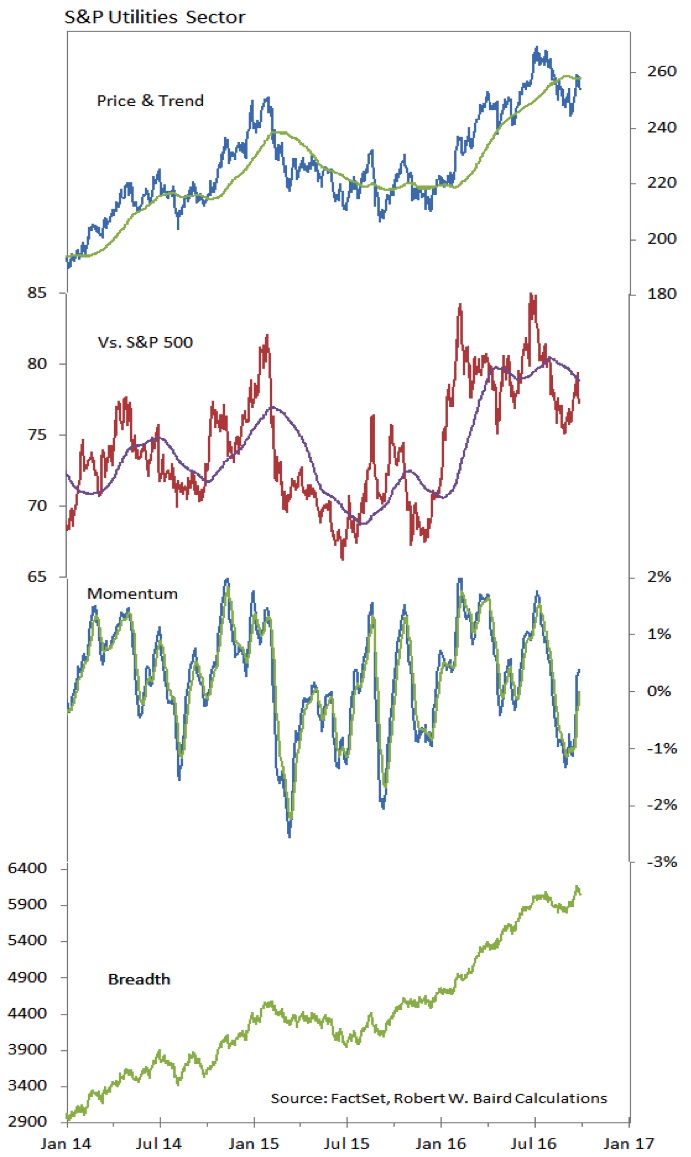
Utilities bounced back in our relative strength rankings this week. That could be short-lived, however, as they have been the worst performing sector in the S&P 500 this week. Relative volatility in the Utilities sector is usually a function of the behavior of the overall market. Now, it appears to be function of the Utilities sector itself. In the third quarter, Utilities have fallen by 9%, enjoyed a 5% rally and have since dropped more than 3%. This is unusual activity in a sector that is known for a lack of volatitly. Breadth witihin the Utilities sector remains strong and momentum has bounced off of its lows, neither absolute nor relative price trends have shown meaningful improvement.
Thanks for reading.
Twitter: @WillieDelwiche
Any opinions expressed herein are solely those of the author, and do not in any way represent the views or opinions of any other person or entity.


