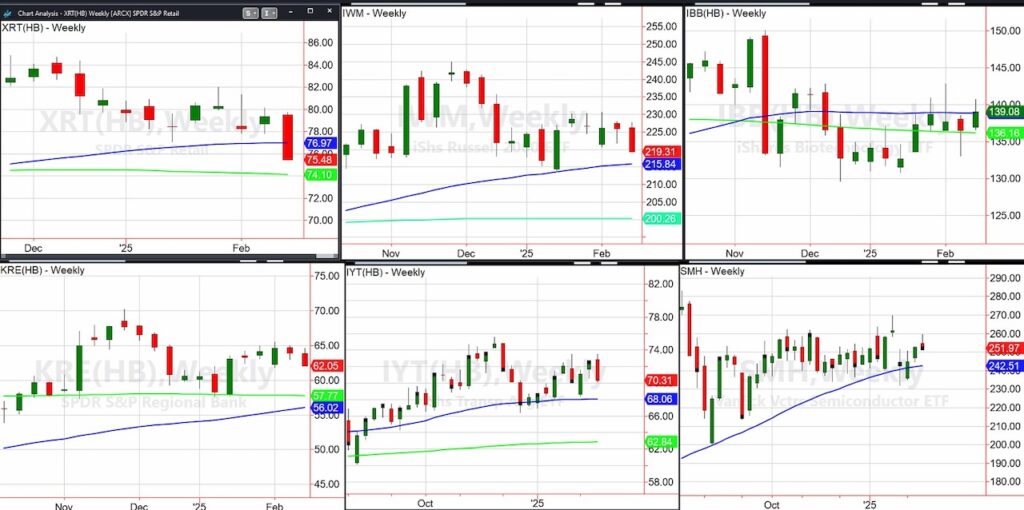
November 2023 was when the Retail Sector ETF (NYSEARCA: XRT) cleared the 50-Week Moving Average (WMA).
February 2025, we are witnessing the Retail Sector (XRT) breakdown below the 50-WMA.
The good news is that
- We like to look at a confirmation of a major weekly phase change after 2 weeks.
- Retail is the only sector below the 50-WMA. Important yes, as I have been hammering home, we need the consumer to stay in the game.
But is this the end of the bull market?
Too soon to say.
Eyes must be on the Russell 2000 ETF (NYSEARCA: IWM) as well. While the Russell 2000 (IWM) is holding the 50-WMA, bulls want to see that continue.
As for the rest of the core economic ETFs we follow, the Transportation ETF (IYT) ranks 3rd as the important “inside” sector of the Economy and Family.
Freight got hit on Friday, but the IYT has not failed the weekly moving averages.
Regional Banks (KRE) and Semiconductors (SMH) weakened but look relatively better.
Biotechnology (IBB) has yet to clear 140 yet continues to look promising as a sector.
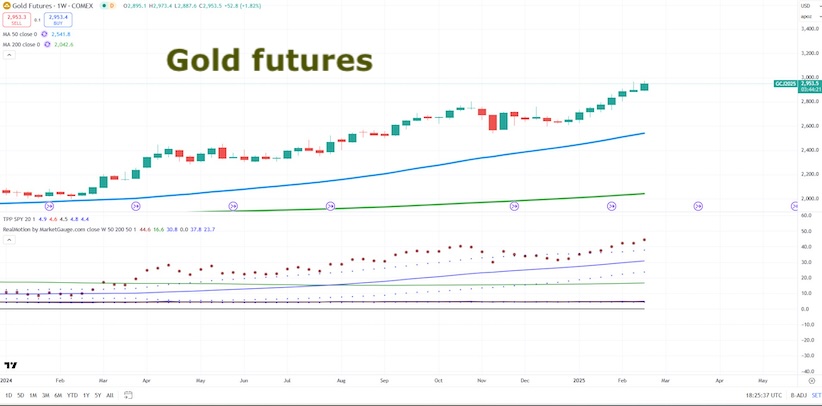
What is also noteworthy is Gold. And the long treasury bonds (TLT).

The gold weekly chart looks like solid gold.
(Incidentally, the purple arrows below the 200-WMA (green) signify contract month changes).
The momentum is also strong.
Flight to safety, yes. Inflation fears, yes.
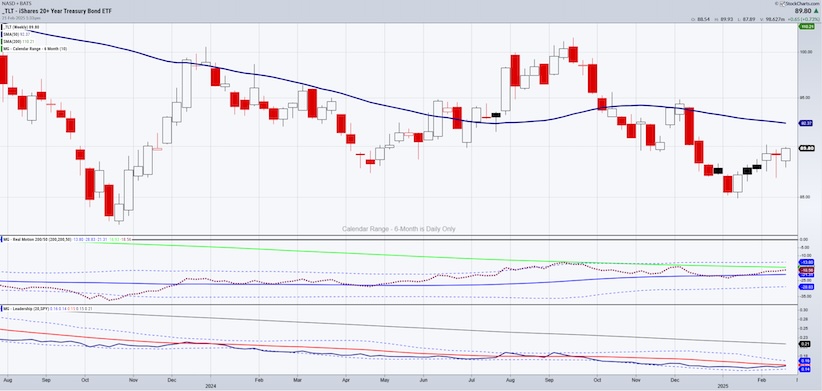
And the flash warning by the Family (particularly the consumer) is not complete without looking at the long bonds TLT.
EVERYONE is convinced that the Fed will stay pat on rates.
Not me. I have written about my prediction for a March pivot in the Outlook 2025.
What does the price of bonds tell us right now?

Zooming out to the weekly chart of TLT, we see a double bottom in play from the lows in October 2023 and January 2025.
In fact, one could say that the move up above the 50-WMA in XRT November 2023 and the move down in yields in October 2023 are connected.
The difference is of course, Trump 2.0.
Regardless, TLT has more to prove. But keep the 50-WMA in your purview.
Should the Fed start to talk more dovish, then the move in XRT could reverse as well (hence the 2-week confirmation).
Of course, the other side effect of lower yields is a tick up in inflation.
Are we looking at inflation or stagflation?
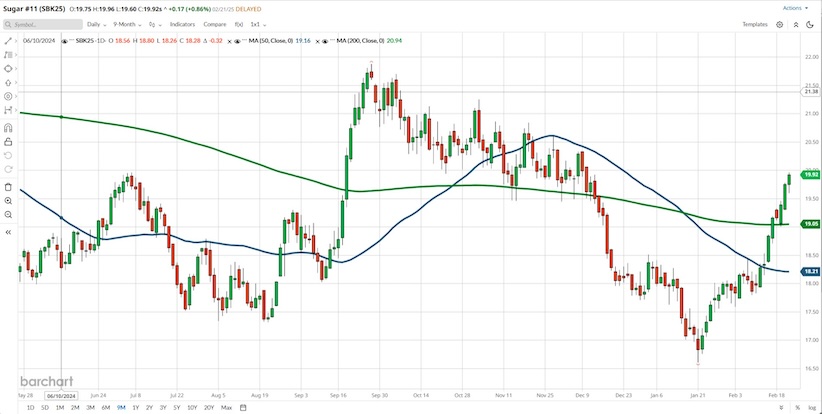
I leave you with the 3rd in my trifecta of inflation-Sugar futures. (After a cheaper dollar and silver outperforming gold).

We are still looking at $.20 cents a pound as the launch pad.
Twitter: @marketminute
The author may have a position in mentioned securities at the time of publication. Any opinions expressed herein are solely those of the author and do not represent the views or opinions of any other person or entity.


