The uptick in volatility this week has many asking: Is the recovery rally over?
Today we look at two simple charts to put things into perspective: the VIX Volatility Index INDEXCBOE: VIX and the S&P 500 Index INDEXSP: .INX.
To be sure, the sharp rally off the lows is hard to assess. And this is for two very divergent reasons:
1). Bullish investors are clearly banking on a sharp recovery from the economic shutdown. 2). The economy has barely even re-opened, scientists and media continue to warn about all sorts of things… basically, we don’t have any idea when this will end and how much of the economy will “open up”. Ponder that for a moment.
Note that the following MarketSmith charts are built with Investors Business Daily’s product suite.
I am an Investors Business Daily (IBD) partner and promote the use of their products. The entire platform offers a good mix of technical and fundamental data and education.
VIX Volatility Index Chart
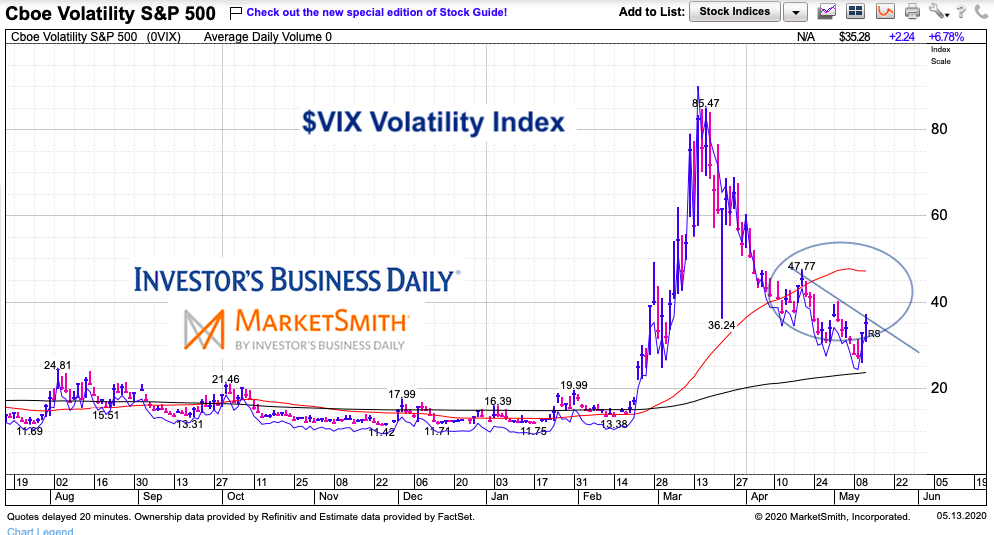
After the March stock market crash, investors have climbed the wall of worry. But with any crash, there are always reverberations. And even when volatility leaves the building, price can still be tricky. In past crises, Volatility often peaks well before the stock market bottoms.
As you can see below, volatility has popped for the 3rd time in 4 weeks. Will it breakout above the downtrend line? Or will bulls continue to show resolve.

S&P 500 Index Chart
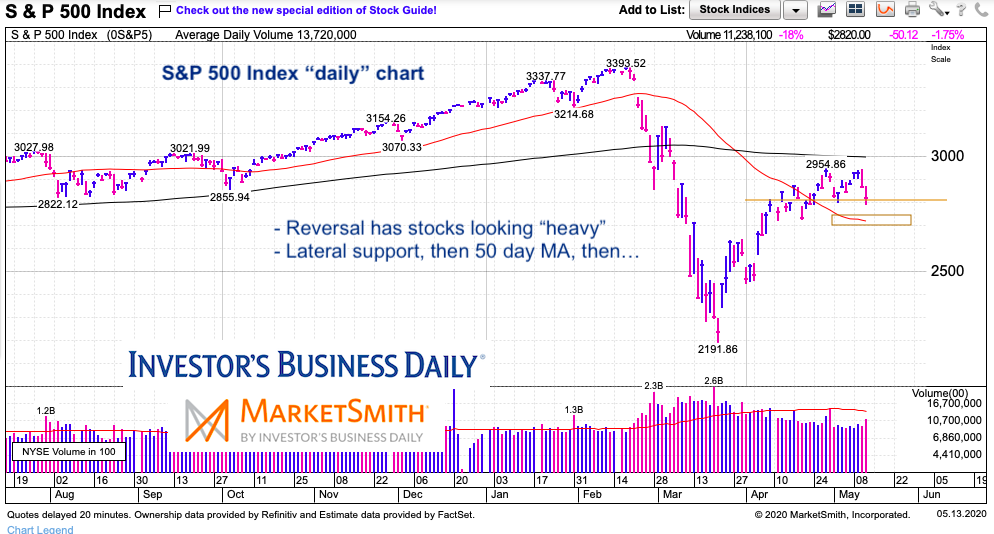
The 2-day price decline has the S&P 500 Index testing lateral support. Just below is the 50-day moving average. Below that and it’s fair to say that a legitimate pullback is underway and Fib calculations and further analysis are warranted.

Twitter: @andrewnyquist
The author may have a position in mentioned securities at the time of publication. Any opinions expressed herein are solely those of the author, and do not in any way represent the views or opinions of any other person or entity.


