The broad market S&P 500 Index (INDEXSP:.INX) is showing some extreme signs of exhaustion following an incredible run post presidential election.
This last leg of the 8 year bull market in equities has shown some aspects that we could begin to equate to a longer term blowoff top. Now to be clear I am generally bullish equities longer term but I have become increasingly bearish in the near term.
The near term catalysts that have propelled markets forward have to do with various aspects of the Trump agenda.
Primarily it has to do with tax reform and the potential for many billions of dollars to come onshore via repatriation, money which, due to the onerous corporate tax environment in our country today, presently sits offshore. That would be extremely stimulative and could create a wave of stock buybacks, capital spending and perhaps even special dividends to shareholders, all of which would be very bullish for stocks.
Other aspects of the Trump agenda have also been seen as beneficial to particular sectors of the economy such as talk of rolling back Dodd-Frank for the banking sector or streamlining drug the FDA drug approval process for the health care sector. Last but not least is the massive proposed infrastructure spending programs which would create many jobs and be very stimulative to the lackluster economy.
What all of these have in common is that they are only proposed policies and even though Trump enjoys a majority in the House and Senate today, for these measures to come to fruition, he will have to have bipartisan support and bipartisan anything is wishful thinking in Washington these days.
Bottomline:
Markets are ahead of themselves here as the saying goes and we have reached some significant measures of overbought that have been telling in the past.
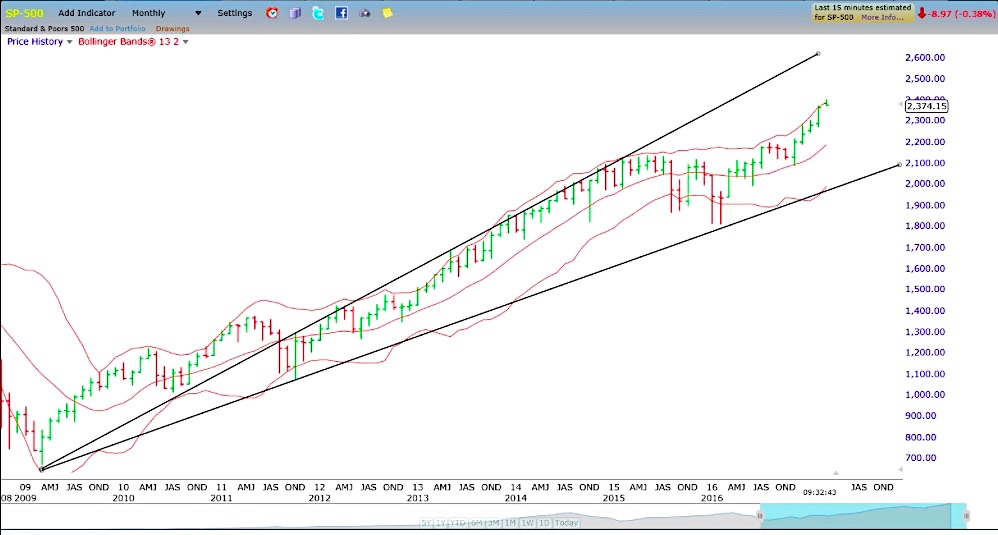
Below is a monthly bar chart of the S&P 500 index. The Bollinger band’s simple moving average (middle line) is set to 13 periods (months in this case) and the outer bands are 2 full standard deviations above and below.
We are trading right up to the 2 STD line already following the major push higher in February. Since the 2009 low, we have not closed above this metric. The last time we closed above this same level was in Dec of 1999 and off course we saw a major pullback thereafter.
So no matter how bullish one may be in the longer term time-frame, the near term probability of much higher price levels, at least looking out through this month of March, are slim and consequently, the potential for a 3 to 5% pullback is elevated.
Markets rarely overshoot this metric to the upside as expectations are usually quickly tempered but often do overshoot these same levels to the downside as we can see in the same chart above. When traders panic, we get sloppy selloffs with everyone trying to get out of the door at the same time as we saw in early 2016.
So as far as my allocations are concerned, I am sitting with 1/4 size positions in several stocks, BAX, MRK, ABT, XOM, AET. Exxon (XOM) and Aetna (AET) are newly opened while the other three have been in the portfolio since late early December 16. Since my last update I have sold TLT, HAL and JBLU. Will visit these on a pullback.
Often part of my strategy is to sell option premium with the hope of being “put” stock at levels I find attractive and will do so on an uptick in voI.
I rarely keep more than 10 positions open in my portfolio and most often manage 6 to 8 positions which is where I am at right now. Lots of cash and I may consider going all cash should we push higher in the SPX this month, above 2 standard deviations from the 13 month SMA although I believe we have put in the high for this month in this index.
Again, this is not a long term bearish call but a tactical trading strategy.
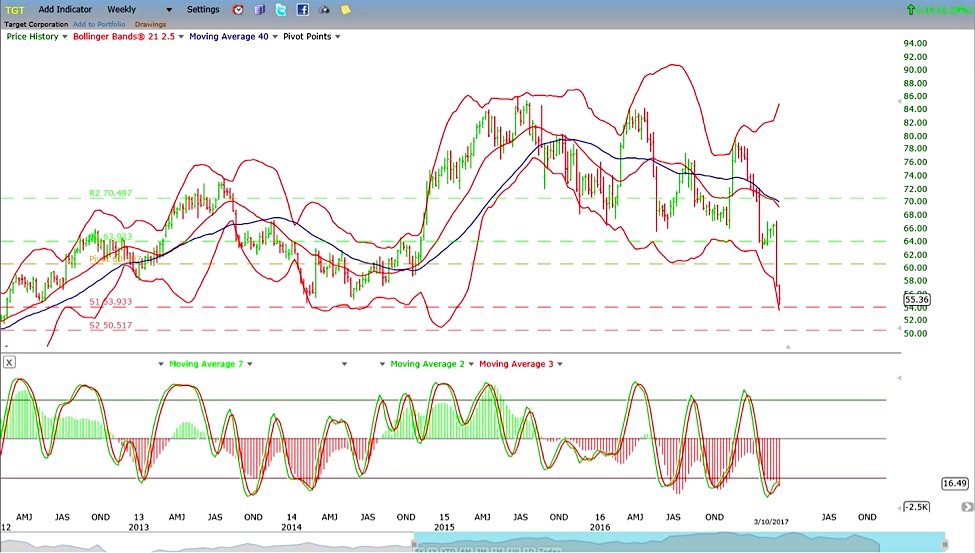
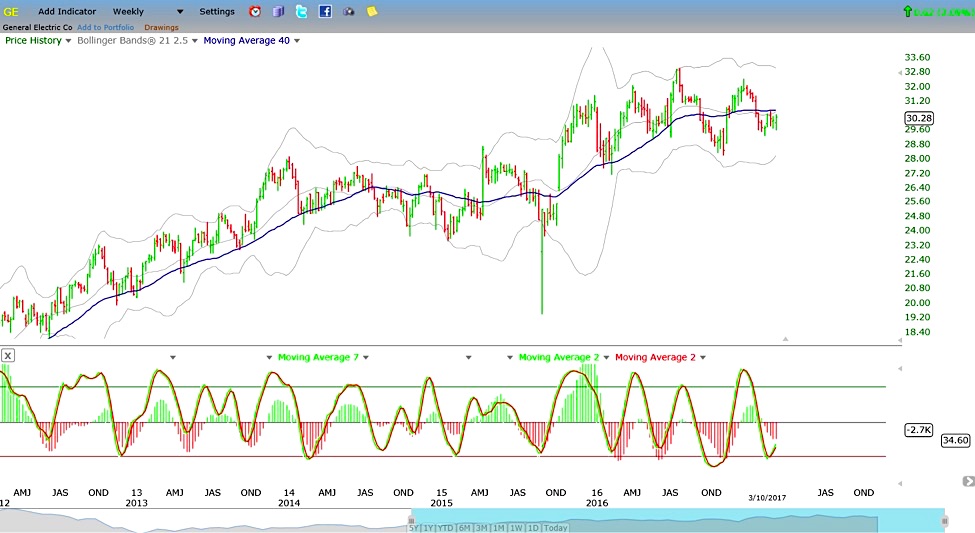
Here are a couple other names I am looking at: TGT and GE
Target Corp Chart (NYSE:TGT)
General Electric Chart (NYSE:GE)
Thanks for reading.
Twitter: @CJMendes
Any opinions expressed herein are solely those of the author, and do not in any way represent the views or opinions of any other person or entity.


