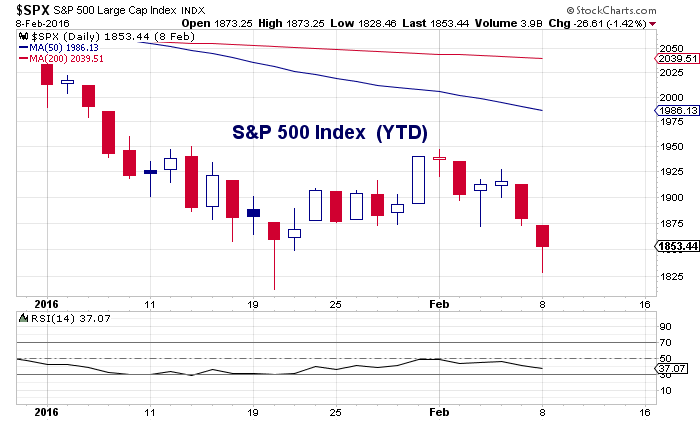
The S&P 500 has undercut its January 20 closing low of 1859 and is moving toward the January 20 intraday low of 1812.
Concerns continue to center on the banking system’s vulnerability to faulty energy loans and other at-risk debt. And this is weighing on the broad stock market index.
Important banks in Europe are breaking levels seen in 2009 which is adding to the uneasiness. Stocks opened this week below near-term support at 1872, which now becomes short-term resistance.
Earnings shortfalls from former leaders have brought the valuation problem to the forefront. This was a concern in 2015 and has carried forward into 2016.
S&P 500 Index Chart – YTD through 2/8 market close
By nearly every measure stocks have been and remain overvalued. Fox example, the price-to-cash flow (based on NIPA profits reported by the Bureau of Economic Analysis) is near 16 while the 60-year average closer to 9. In a robust economy, growth can help reduce stock market valuations over time. But with GDP growth still struggling to find a higher gear after five years of economic recovery, both top- and bottom-line growth have been difficult from a corporate perspective.
Fed Chief Janet Yellen appears before Congress on Wednesday and Thursday and we assume she will offer some comforting remarks. The fact is, however, that monetary policy is a poor tool for fixing secular problems in the economy.
This requires friendly fiscal policy that at present is not available. The stock market, however, is a forward looking mechanism and if it senses that a change in fiscal policy is near it will rally long before the event. Growth allowed in the final quarter of 2015, but the U.S. economy is unlikely to fall into recession. The industrial sector is weak but the service sector remains relatively strong. Should the ISM non-Manufacturing Index (at 53 in January) fall below 50, it would raise the odds of recession significantly.
Fewer individual issues are joining the S&P 500 in making new lows. While this is a minor encouragement, it alone is unlikely sufficient to stem the selling. To gain increased confidence that a meaningful bottom for stocks is close we would likely need to see at least two of the following:
1) The CBOE Volatility Index above 40.
2) Two days where upside trading volume exceeds downside trading volume by a ratio of 10-to-1 or more without being interrupted with a 10-to-one down day for stocks.
3) Two sessions where the Traders Index (.TPIN) is above 2 (or one session above 5 which would indicative of a selling climax).
The Bottom Line: Investor sentiment work shows pessimism but selling pressure not yet exhibiting signs of exhaustion.
This post was written with Bruce Bittles, Chief Investment Strategist at Robert W. Baird & Co.
Twitter: @WillieDelwiche
Any opinions expressed herein are solely those of the author, and do not in any way represent the views or opinions of any other person or entity.


