S&P 500 FUTURES – SEPT (SPm6)
2129-30, 2121-2, 2080-2, 2071 Price Support
2138-40, 2145-6, 2160-2 Price Resistance
S&P Futures Trading Outlook (2-3 Days): Bullish into late Tuesday/Wednesday – still looks a bit early for traders to fade this move. The S&P 500 Index (INDEXSP:.INX) managed to eclipse last May’s highs and officially moved back to new all-time highs territory.
First trading resistance at 2145-6, then 2160-2. For now, the trend is bullish, but just stretched near-term. Many indices are nowhere near all-time highs. Therefore, this initial burst will likely prove sell-able, for trading purposes.
TECHNICAL THOUGHTS
S&P 500 (SPX) is back at new All-time highs. Is this an “ALL CLEAR”? Not quite yet. That said, it is encouraging to see S&P 500 make this move along with the Dow Jones Industrial Average (INDEXDJX:.DJI) being within 0.6%. Many indices remain well off highs, so it’s still a bit misleading to say the market’s back at all-time highs. Yet, it’s a constructive move which happened on very good breadth, and once the S&P Mid-cap and Small-cap indices can join the S&P, it will be far easier to have more confidence in this rally. For now, there were ample reasons to think this consolidation would breakout to the upside and it was wise to position as such. A few of these are as follows:
1) The Advance/Decline line is back at new all-time high territory for NYSE “All Stocks”. This follows the NYSE Cumulative All securities hitting new all-time highs
2) An expansion in stocks hitting new 52-week highs to new 12-month highs in early June, while breadth indices such as the McClellan Oscillator and Summation index moved to new 12-month+ highs in late April. It was also telling that the % of Stocks above their 50-day and 200-day moving averages spiked up to their highest levels since at least 2014 in April and early June, far above last November/December peaks. This suggested that breadth was moving up AHEAD of price, something that typically happens in reverse at peaks, when breadth fails to confirm a price new high. This time around, breadth moved up aggressively ahead of price.
3) Sentiment had shown lukewarm readings at best in the last few months, with popular gauges such as AAII, or DSI showing very muted readings in sentiment despite indices being within striking distance of new all-time highs (SPX). Issues like the BREXIT, or slowing Chinese growth, indecision regarding Fed policy all seemed very formidable factors which shed a lot of indecision on the market with prices so close to all-time highs. Additionally, the Total put/call ratio hit 1.40 in mid-June, an odd move to multi-month highs with SPX only 60 points from its all-time highs.
4) Sector rotation started to show sharp movement into Healthcare from mid-June while Technology, Industrials and Consumer Discretionary began to trend higher ahead of when the actual breakout occurred, while Utilities and Telecom began to trail off, despite yields remaining near lows
5) Junk Bonds had never shown much sign of technical damage when eyeing either JNK, or the spread between High Yield and investment grade, which likely would have widened out substantially ahead of a serious meltdown in equities.
Bond yields showed some additional signs of lifting Monday and very conceivable that yields could lift a bit as equities rise. The one disturbing issue with regards to celebrating the S&P 500 (SPX) move too heartily concerns the degree that yields globally remain low along with European and Asian equities being in far worse technical shape. Can the US truly rally and lead all others up, or is this move temporary? For now, it pays to trust this SPX move given the sector and breadth developments, but the long-term health of this rally from this point on will depend on a serious move higher in Transports and Small-caps with Mid-caps moving back to new high territory. Given that nearly 65% of ALL STOCKS were down more than 20% from their 52-week highs typically doesn’t bode well for an immediate snapback that has real longevity. For now, its paid to stay long and stick with this move, but continued participation and upward breadth acceleration will be vital now that indices are starting to claw back towards all-time highs led by the SPX. Stay tuned.
Dow Jones Industrial Average (DJIA)
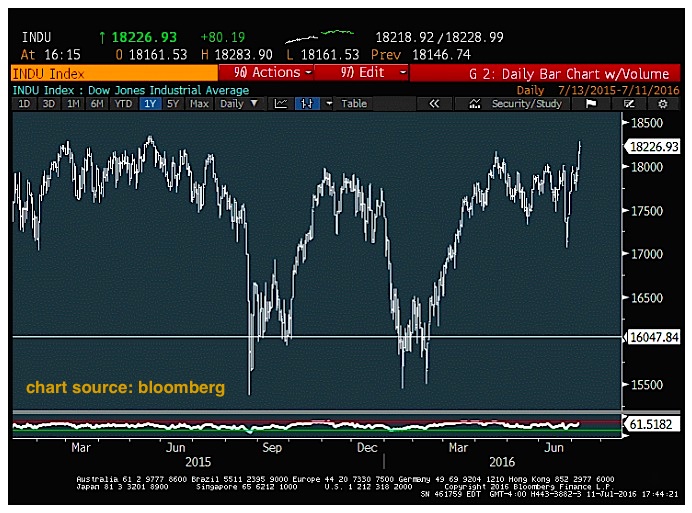
The DJIA pattern truly looks attractive when looking back only a year and seeing the two intermediate-term lows followed by consolidation near the highs which is now giving way to a breakout attempt, similar to what the SPX achieved today. The near-term remains bullish, but understandably stretched given such a sharp move in a short period of time. While some might choose not to focus on the DJIA, it’s had a predictable 90-95% correlation with the SPX over time, so still important when this moves to new highs to confirm the move made by SPX. In this case, that level lies at 18351.36, or just 125 points higher. If indices like the DJIA and NDX, CCMP cannot join the SPX in the days/weeks ahead, it would lead to more meaningful consolidation before this big breakout happens across all indices. For now, most patterns are positive near-term and this sudden burst back to new highs doesn’t immediately look “sellable”
Thanks for reading.
Twitter: @MarkNewtonCMT
The author may have a position in mentioned securities at the time of publication. Any opinions expressed herein are solely those of the author, and do not in any way represent the views or opinions of any other person or entity.


