Less than a month ago, I pondered the question “Is It Time To Wave Goodbye To the Bull Market In 2016?“. In that post, I gave you S&P 500 fibonacci levels to watch for support. Let’s review and provide an update.
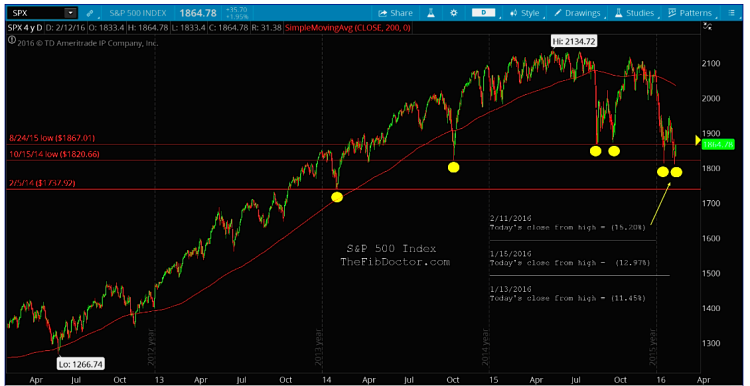
At that time, 1867.01 had already been tested so our focus was more on 1820.66 and 1737.92.
In that post from January 19th, 2016, I cautioned readers:
“…you’ll want to monitor this closely for a daily candle CLOSE below 1867.01. That would open the door for another 47 point drop easily.”
Price did close under 1867.01 and that did indeed open the door for two pullbacks of 54.72 and 56.91 points, with the low being 1810.1 on February 11th, 2016. Buyers did come in below the second support level of 1820.66 and were able to push the closing price back above that level.
Key S&P 500 fibonacci levels that are noted in the chart below along with the current correction of (15.20%).
S&P 500 Index – 4 Year Daily Chart
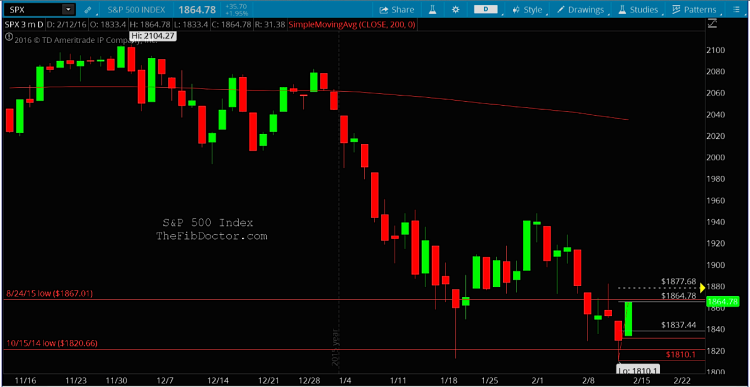
Now let’s drill down to a 3 month time frame and see what our S&P 500 Fibonacci levels are telling us.
Currently, the closing price on Friday, February 12th of 1864.78 gives us a short term Fibonacci target of 1877.68 with support levels at 1837.44 and 1830.99. As you can see in the below chart, that target is above our now resistance level of 1867.01.
At this point, you should monitor these levels closely for hints of a continuation of the 7 year bull market or a further correction.
S&P 500 Index – 3 Month Daily Chart
Thanks for reading and always use a stop!
Continued reading by Dave: “Crude Oil Declines Into Major Fibonacci Price Target, Then Rallies“
Twitter: @TheFibDoctor
No position in any of the mentioned securities at the time of publication. Any opinions expressed herein are solely those of the author, and do not in any way represent the views or opinions of any other person or entity.


