It’s about that time of year again.
Soon is the time when consumer sentiment is about to go through the ultimate test – Black Friday.
Black Friday is traditionally the busiest shopping day of the year for retails stores.
In 2018, traffic to stores fell as much as 9 percent from 2017. The number of people visiting stores in 2017 was 4 percent lower than in 2016.
Many retailers, including Amazon, offer deals way earlier, upstaging Black Friday itself. The competition is so fierce, stores are innovating new ways to get your dollar.
Online sales are the best on Thanksgiving Day, not Black Friday. The average discount is 24 percent.
Nonetheless, the true measure of the day that kicks off the holiday season, will come after Cyber Monday, or after the now 5-day event.
Many analysts and investors scoff at the notion that Black Friday has any real predictability for the fourth quarter or for the markets.
Instead, they suggest that it only causes very short-term gains or losses.
But I say, let’s talk to Granny as her chart tells her story. He’s our Retail Sector ETF NYSEARCA: XRT

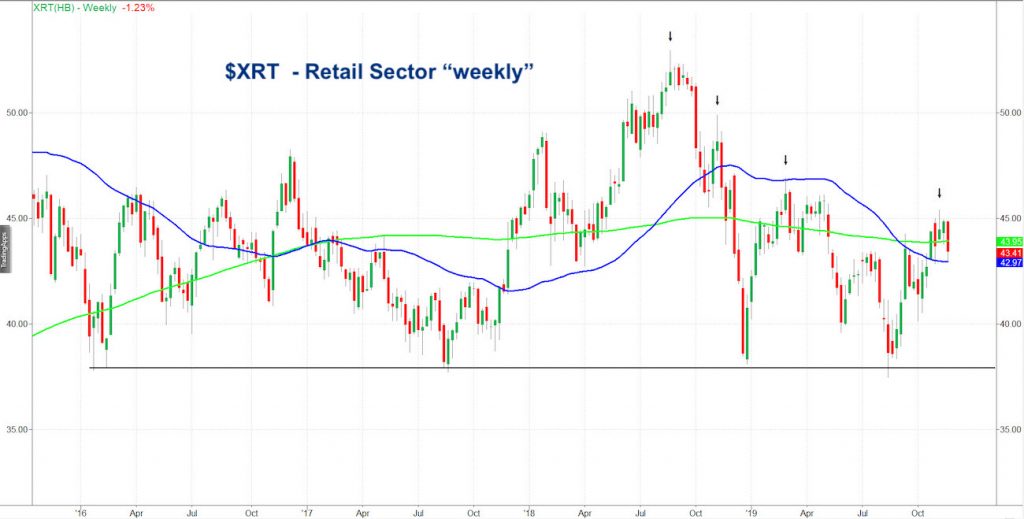
The chart shows the weekly price action of the Retail Sector ETF (XRT) from 2016 until the present.
The black line or trendline sits at the incredible support XRT has had each time it reaches $38.00.
One could say that with 5 or more attempts to pierce that level only to see buyers come back, is nothing short of incredible.
Yet also noteworthy is the down arrows you see beginning at the zenith in October 2018.
Each subsequent arrow indicates a peak price that is substantially lower than the peak price that precedes it.
The last peak price happened the week of November 8th with a high of 45.41.
This series of lower highs is troublesome until (if) that pattern breaks.
That means we need to see a weekly price close above 45.61-a tall order.
Furthermore, with XRT below the 200-WMA (green line) yet still above the 50-WMA (blue line), the phase suggests the anticipation of another year of declining traffic this Black Friday.
Should XRT break below 42.97, we could very well be looking at a 6th attempt to find support at 38.00.
As 70% of the Gross Domestic Product, Granny matters.
Oh sure, she’s old and not as sexy as say, Sister Semiconductors.
But, she has wisdom and the patience investors need to acknowledge.
So analysts, if this sector was the only one of the Economic Modern Family under pressure, I’d say go ahead and scoff at the relevancy of Black Friday.
With Transportation, the Russell 2000, Biotechnology and Regional Banks also significantly underperforming the S&P 500, NASDQ and tech, I say Granny’s short-term losses or gains this year, will count way more than it has in the last 3 years.
S&P 500 (SPY) 310 pivotal especially on a closing basis. But with today’s close under yesterday’s low, the suggestion for an interim top is strong, unless it takes out the all-time high 312.69.
Russell 2000 (IWM) 155-156 Key support. 157.75 Pivotal. 160.46 resistance.
Dow Jones Industrials (DIA) Like SPY, this closed lower than yesterday’s low suggesting an interim top unless it takes out the new all-time high at 280.84. Plus, it failed the 10 DMA.
Nasdaq (QQQ) With 202.59 yesterday’s low, this too closed below it but above the pivotal 10-DMA at 201.86. All-time highs at 203.84.
KRE (Regional Banks) 54.00 support. 56.15 some resistance.
SMH (Semiconductors) 135.26 all-time high. Breakaway gap intact if holds 130. 133.30 pivotal.
IYT (Transportation) 190 key support and back over 196 better.
IBB (Biotechnology) 111 support. 115 major resistance.
XRT (Retail) 42.95-43.05 key support.
Twitter: @marketminute
The author may have a position in the mentioned securities at the time of publication. Any opinions expressed herein are solely those of the author, and do not in any way represent the views or opinions of any other person or entity.


