As we move into the Winter solstice, or the shortest day of the year for North America, stocks continue to show signs of resilience. With just seven full trading days left in the year, most US stock market indices are back at new all-time highs.
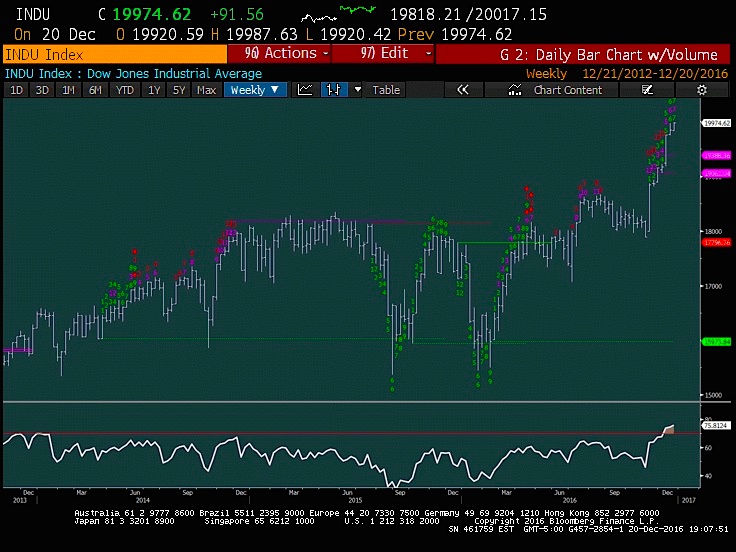
This is all occurring as the Dow Jones Industrial Average (INDEXDJX:.DJI) closes in on another historic landmark, Dow 20,000.
Given that it took less than two months to rise more than 2,000 points, without even stopping for a breath at 19,000, this move has certainly come about very quickly. The move has largely defied expectations and emboldened those who are long stocks. For now, additional upside still looks likely over these final days, but is growing increasingly stretched, and up to targets where much further upside should prove difficult into the new year.
The Combination of overbought conditions, counter-trend “sells” per Demark, and bullish investor sentiment are likely to take a toll on stocks in the month of January. For now, though, yesterday’s move above 2264 likely spurs on further strength given that Dow Jones and NASDAQ are back at new all-time highs while the S&P 500 Index (INDEXSP:.INX) is within a few points.
When considering Dow 20k, as we all know, it’s much more psychological than important technically speaking. It took just three years to go from Dow Jones 15k to Dow Jones 20k, yet 14 years to go from 10k to 15k. In that same token, DJIA 1000 was nearly hit back in 1966, but wasn’t officially surpassed on a daily close until 1972, but just briefly before the horrific 1973-74 bear market took hold. It was not until 1982 that this historic 1,000 landmark was surpassed for good.
The mentioning of these levels, however, DOES play a critical role in giving conviction to those that are long, while nudging others to join the party. This often occurs at the exact wrong time. Investor sentiment tends to grow around round numbers, which is largely Media-driven. Finally, with regards to the Dow, it IS significant to keep track of this price-weighted index, despite stocks like GS carrying the heavy load for the index of late. The Dow Jones Industrial Average tends to correlate very positively with S&P 500 and the divergences created by confirmation (or lack thereof) tend to be important. Given my thoughts of stocks potentially peaking out at end of year, technically, I think it’s more likely that the Dow Jones revisits 19k before hitting 21k.
Here’s a quick look at the charts.
Dow Jones Industrials
The Dow Jones lies just 25 points away from 20k, a level that’s sure to be hit in the next three trading days, today included. For now, Tuesday’s push back to new high territory argues for a bit more upside into end of year, with targets near 20115, but is unlikely to continue upwards uninterrupted given the combination of upcoming counter-trend confluence between daily and weekly charts while Weekly momentum gauges like RSI have reached the highest levels in three years. For now, technically, we’re overbought, but quite stretched and closing in rapidly on near-term targets.
S&P 500
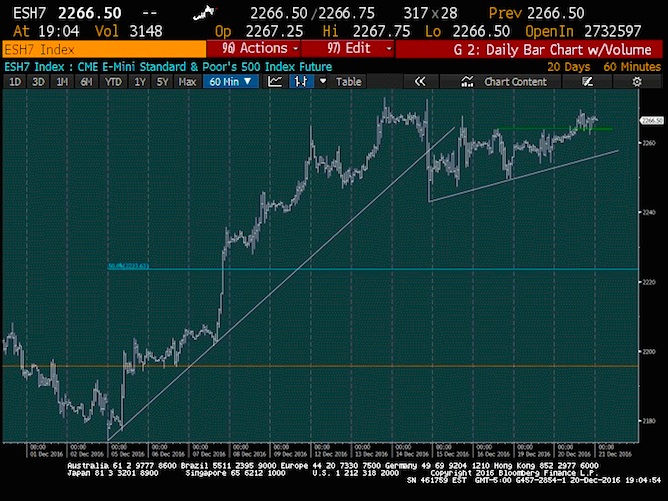
The hourly chart of S&P 500 futures shows the progress that was made on Tuesday. The index pushed back up to within striking distance of new highs yet again.
This has now taken the shape of an ascending triangle pattern, and should allow for brief new highs, as technically it’s seen as much more constructive, then Bearish. The pullback attempt last week, after breaking this minor uptrend, really gained no traction whatsoever – simply grinding sideways for the last week before pushing higher Tuesday. For now, the path of least resistance still looks to be higher.
charts created at Bloomberg Finance
Note that you can catch more trading ideas and market insights over at Newton Advisor. Thanks for reading.
Twitter: @MarkNewtonCMT
Any opinions expressed herein are solely those of the author, and do not in any way represent the views or opinions of any other person or entity.


