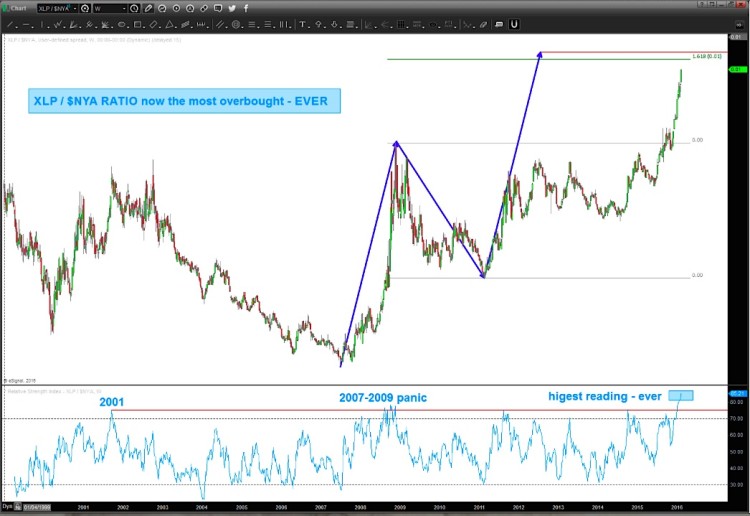
As the stock market has continued its move lower, one chart has proved helpful as a warning (and an indicator) to investors. That is the Consumer Staples relative strength chart (vs the NYSE).
I shared this chart a couple weeks back with the note that the stock market likely hadn’t bottomed. Here’s an excerpt from that post:
I’ll likely flip sides from cautious to bullish when consumer staples strength subsides. As you can see in the charts below, the Consumer Staples $XLP performance relative to the broader market (NYSE stock market index – $NYA) has been strong.
I’m waiting for the target shown in the chart below (updated) to be hit, followed by a weekly reversal candle.
As you can see in the updated chart below, this ratio has been SPOT ON with providing market inflection points. In short, the pattern recognition targets show investors “risk on” and “risk off” flow of funds based on the consumer staples relative strength.
In times of risk off the big guys go to toilet paper, toothpaste, canned goods and blah blah blah… i.e. consumer staples stocks (defensive).
On this weekly chart, you can see a SELL PATTERN on the ratio. That’s good for equities IF IT HOLDS. Personally, though, I’m not doing a darn thing till that pattern is hit because, until then, we are likely to see more downside.
The probability that the ratio sells off after the target is hit (along with equities bottoming and going higher) is increased due to the fact that since the Consumer Staples ETF (XLP) came into existence, the Consumer Staples Relative Strength Index has never been this high… so, stay tuned. But, it’s still my belief that we should wait to go long stocks until this pattern hits its upside target.
Thanks for reading and be safe out there.
Twitter: @BartsCharts
Author does not have a position in mentioned securities at the time of publication. Any opinions expressed herein are solely those of the author, and do not in any way represent the views or opinions of any other person or entity.


