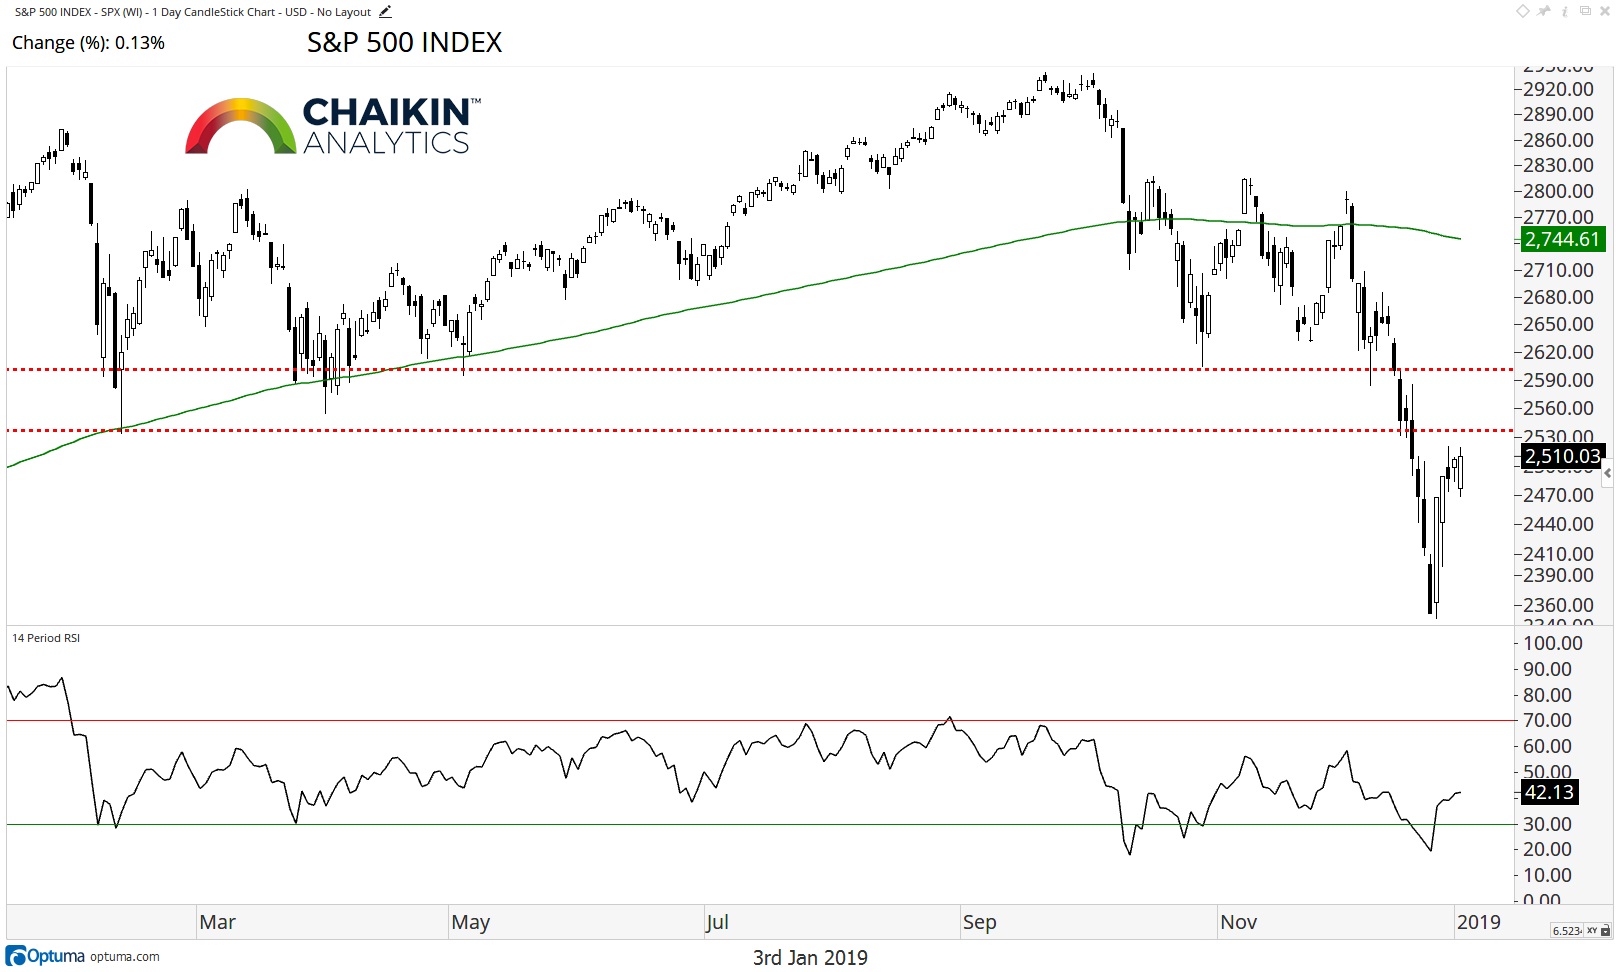
The S&P 500
The S&P 500 has staged a counter trend rally from the December lows but remains below resistance at 2,530 (February lows) and the declining 200-day moving average.
Watch this general price area to see if bulls can neutralize the selling momentum.
The RSI is in bearish ranges, lending a momentum confirmation to the bearish trend in price for the index. Charts through Wed close.
Looking at Market Breadth…
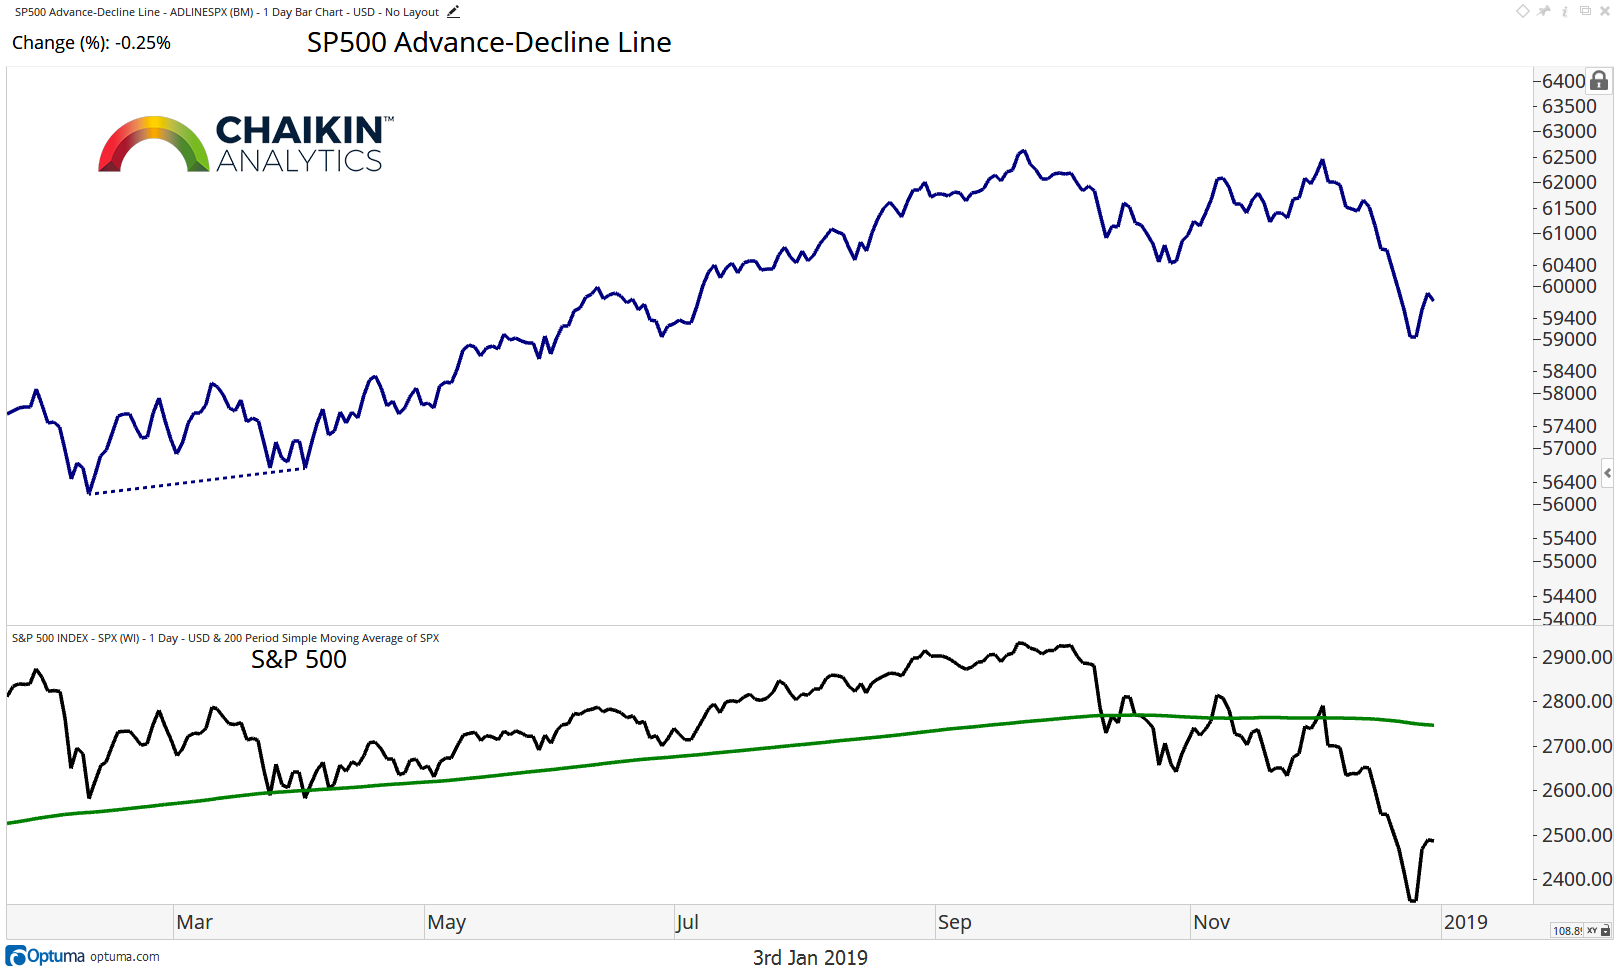
S&P 500 Breadth
The Advance / Decline Line for the S&P 500 continues to track the index, lending a breadth confirmation to the bearish price trend. In order to have confidence that a durable base is forming, we want to see the market’s lows tested while the A/D line makes a higher low, similar to the April set up which preceded the move to new highs for the index.
The 8-day moving average of the percentage of stocks in the S&P 500 making new 52-week lows has moved lower with the rally in the market since Christmas Eve. However, the most recent spike marked a five-year high and confirmed the weakness in the market. We want to see the market make a “less intense” test of the lows to signal a base is forming for the index.

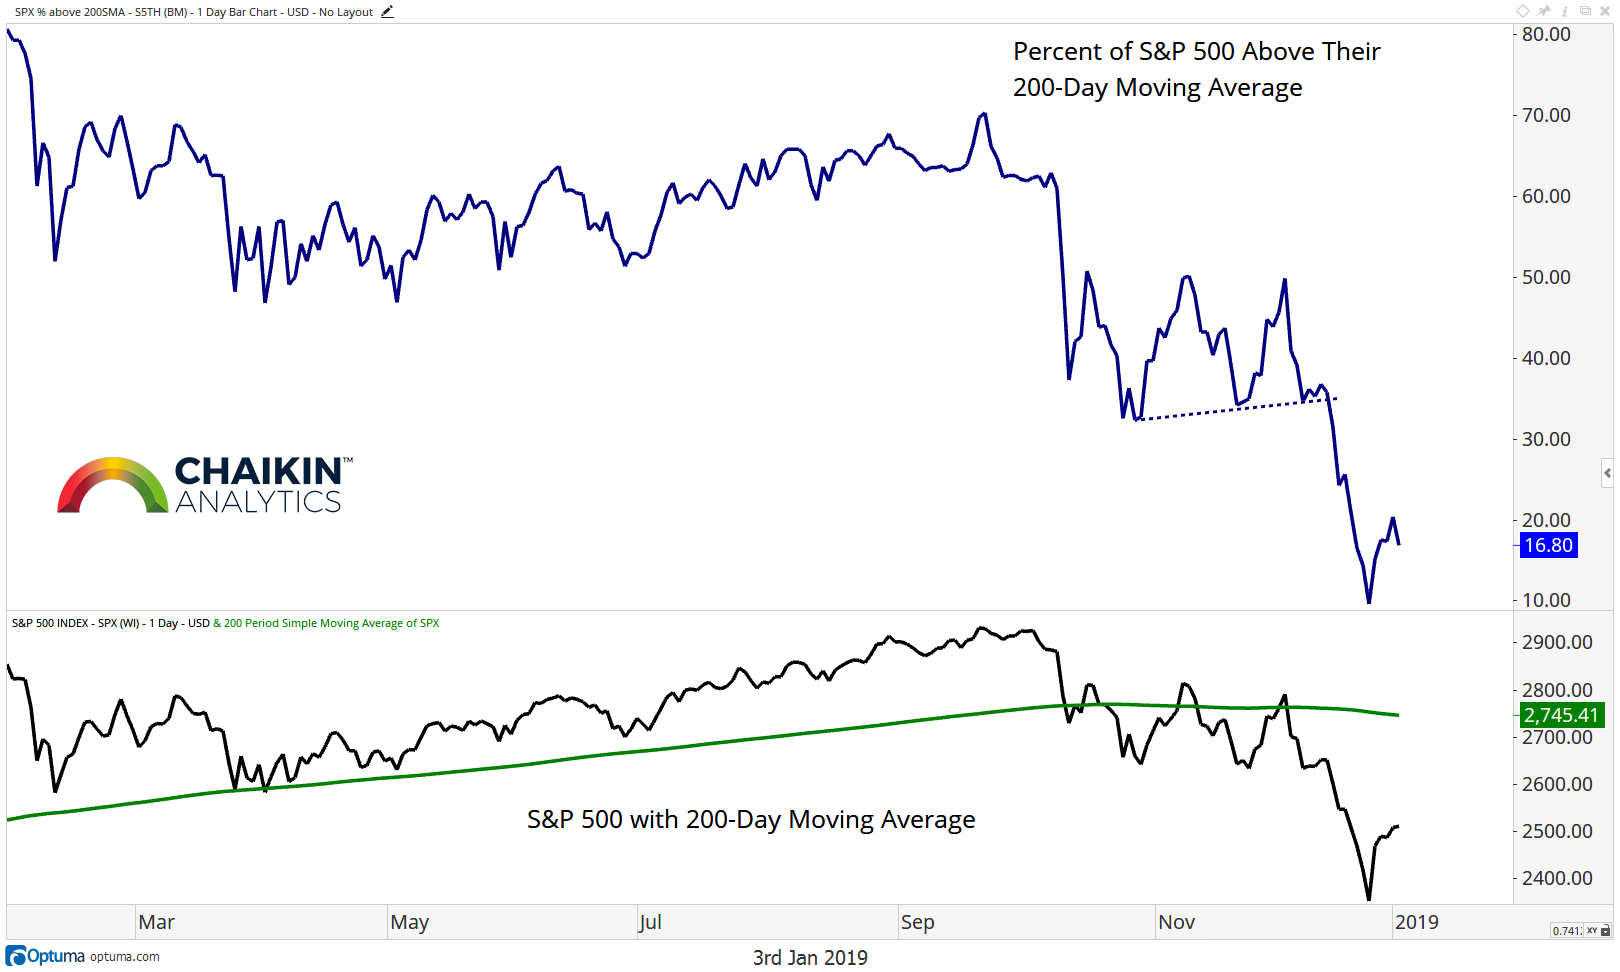
The percentage of stocks trading above their respective 200-day moving averages rose to 16.8% from 15% last week. Bulls want this metric to retake the 60% mark to signal that a healthy majority of stocks are in long-term uptrends. So far, we have not seen the positive divergence which leads us to believe that a durable base is building.
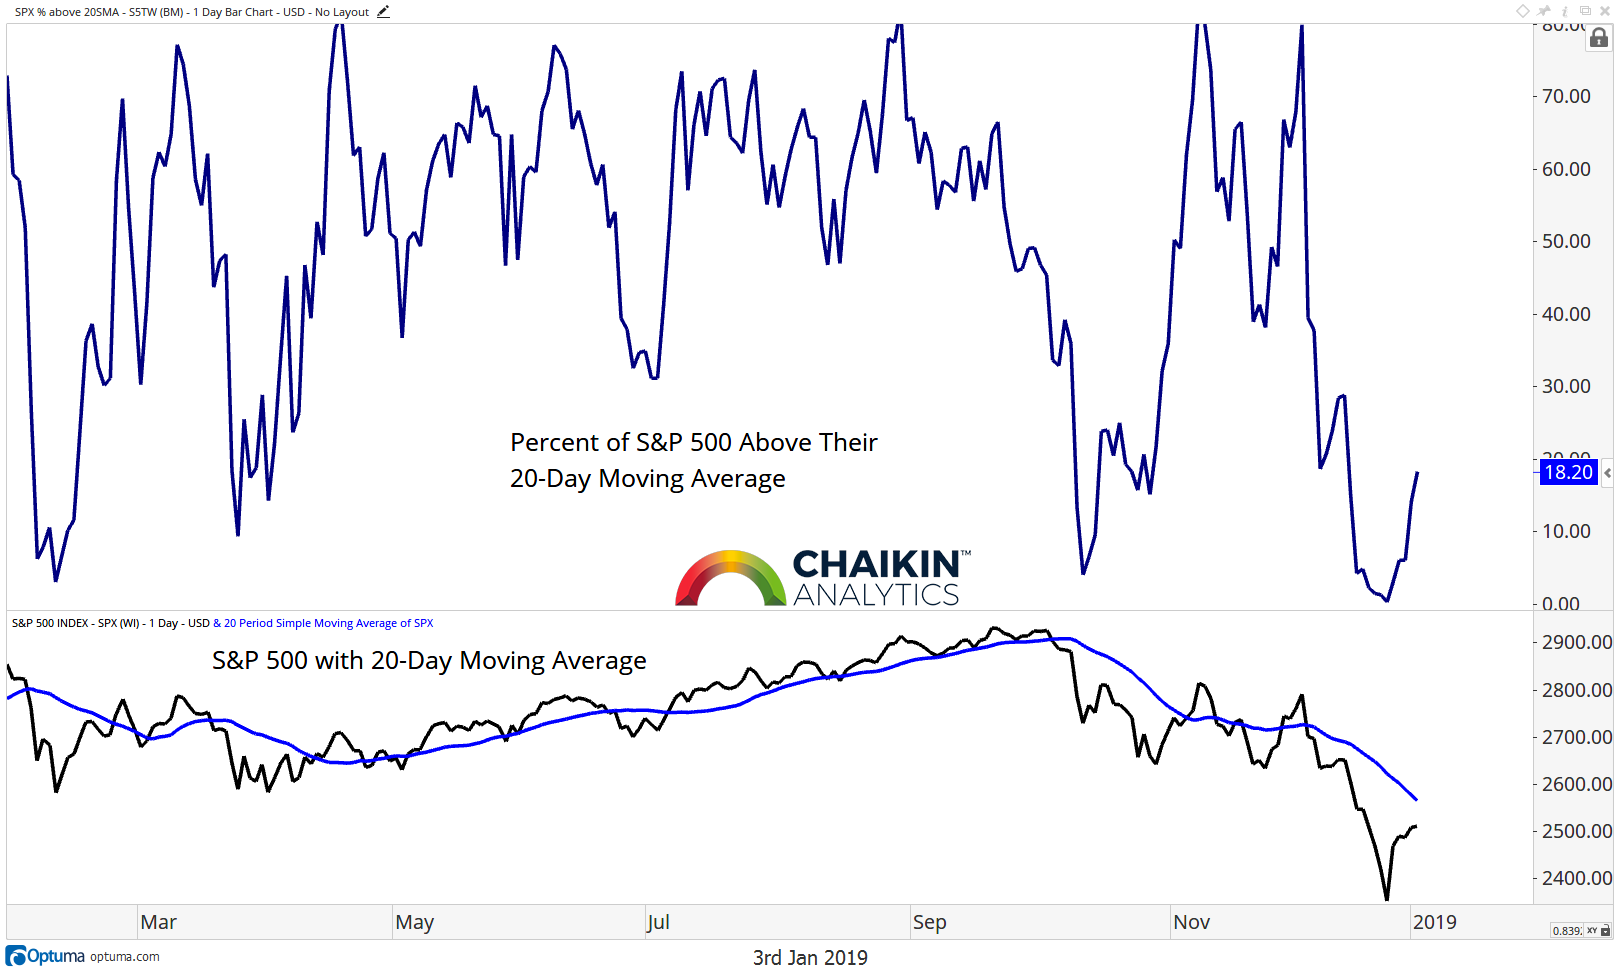
When we look at the percentage of stocks above their respective 20-day moving averages, we can see the reading moved to 18% from 2% last week. In last week’s note, we wrote“This short-term measure of market breadth is now below levels which have marked tradable lows in the past”. The market has, in fact, rallied from the lows but we consider the move to be countertrend in nature.
Global Markets Update
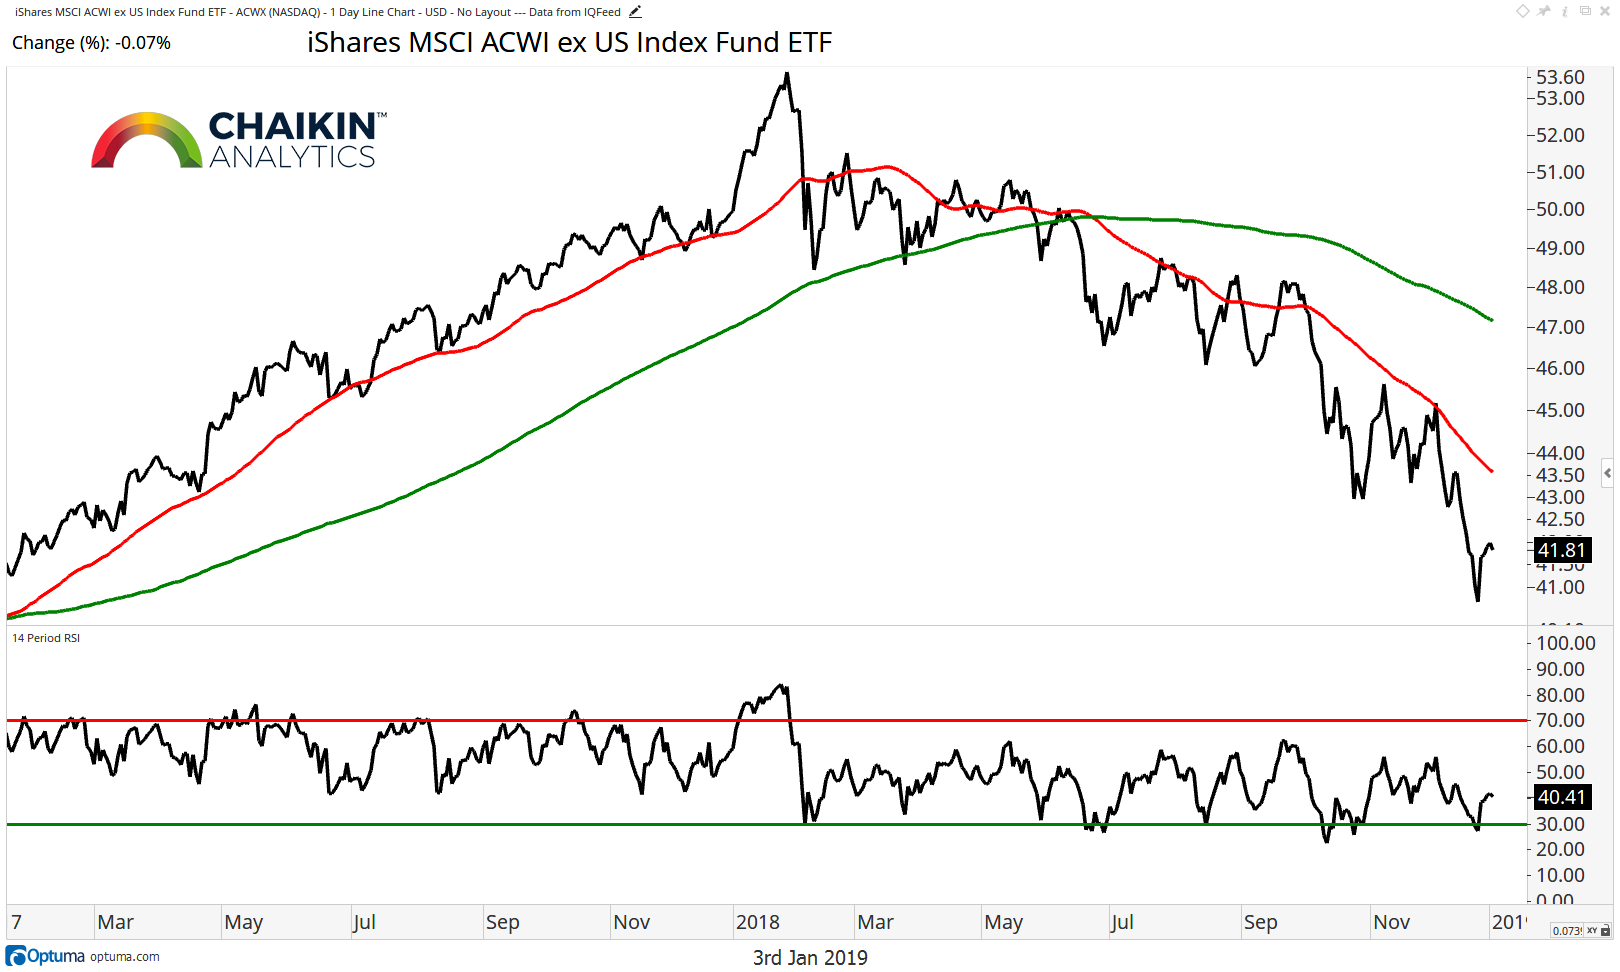
Currently only three of the 33 country ETFs which we track are above their 200-day moving average.
As we can see in this chart of the MSCI ACWI ex-U.S. Index Fund (ACWX), the fund remains in a downtrend and has broken support at the October and December lows. The RSI remains firmly in bearish ranges.
Takeaway: Based on the breadth metrics we track; the market will likely need time to form a durable base from which a stronger rally can begin. We would like the S&P 500 to test and hold the December lows while leaving positive breadth and momentum divergences in place. Until that time, rallies in the market should be considered counter trend in nature.
Twitter: @DanRusso_CMT
Author may have a position in mentioned securities at the time of publication. Any opinions expressed herein are solely those of the author, and do not in any way represent the views or opinions of any other person or entity.


